Bar-ish on Bay St - Gung Ho or How AI Broke the S&P 500
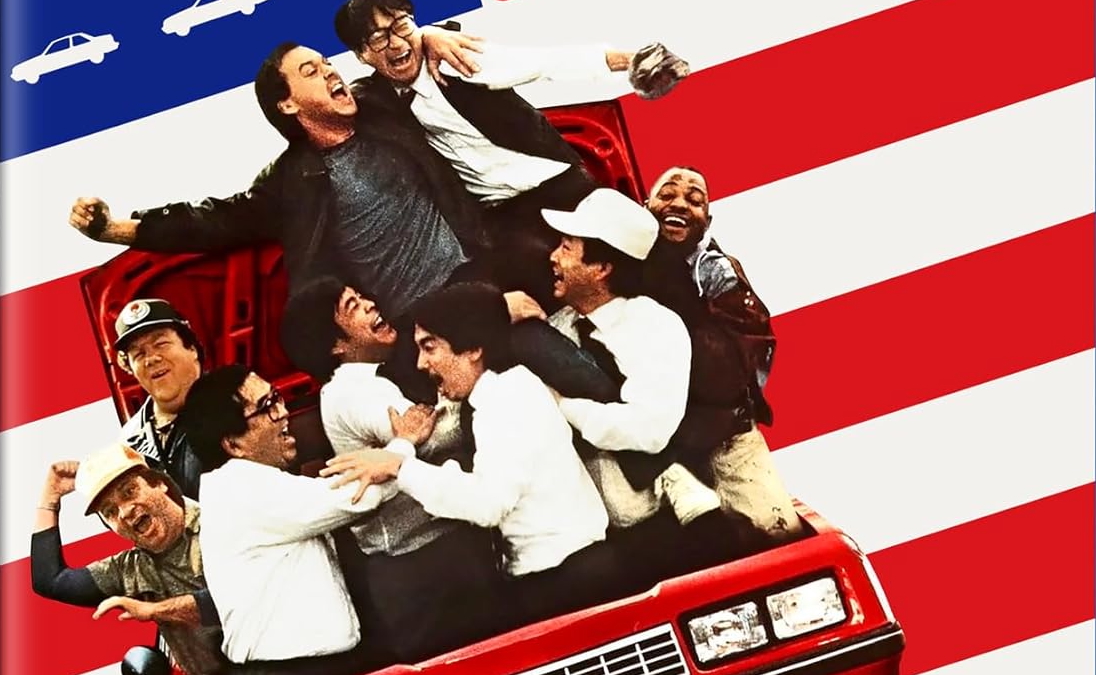
Before he was Batman (and before he was market-corrected by Tom Hanks), Michael Keaton had a moment in the mid-1980s. Today, we are going to “Keaton-focus” on the 1986 Ron Howard comedy Gung Ho. For those not familiar with “Ho”, Keaton plays Hunt Stevenson, a fast-talking foreman of a shuttered auto plant who convinces a Japanese carmaker – the fictitious Assan Motors - to reopen the auto plant in Stevenson’s Pennsylvania hometown. Assan Motors agrees and as you might imagine – mayhem ensues.
While Gung Ho is riotously funny (okay, it’s not, but it had Norm from Cheers, so it wasn’t all bad), it had a not so hidden message - Sony had bought Columbia Pictures, Mitsubishi Estate had bought Rockefeller Center, and Japanese companies held 32 of the world’s 50 largest market capitalizations. In other words, the era of America was at an end, and the era of Japan had begun.
Before he was Batman (and before he was market-corrected by Tom Hanks), Michael Keaton had a moment in the mid-1980s. Today, we are going to “Keaton-focus” on the 1986 Ron Howard comedy Gung Ho. For those not familiar with “Ho”, Keaton plays Hunt Stevenson, a fast-talking foreman of a shuttered auto plant who convinces a Japanese carmaker – the fictitious Assan Motors - to reopen the auto plant in Stevenson’s Pennsylvania hometown. Assan Motors agrees and as you might imagine – mayhem ensues.
While Gung Ho is riotously funny (okay, it’s not, but it had Norm from Cheers, so it wasn’t all bad), it had a not so hidden message - Sony had bought Columbia Pictures, Mitsubishi Estate had bought Rockefeller Center, and Japanese companies held 32 of the world’s 50 largest market capitalizations. In other words, the era of America was at an end, and the era of Japan had begun.
Matt Barasch
October 26, 2026
Before he was Batman (and before he was market-corrected by Tom Hanks), Michael Keaton had a moment in the mid-1980s. While none of his pre-Batman movies were particularly successful (although Mr. Mom is a delight), they would presage a career that is now in its sixth decade. Today, we are going to “Keaton-focus” on the 1986 Ron Howard comedy Gung Ho. For those not familiar with “Ho”, Keaton plays Hunt Stevenson, a fast-talking foreman of a shuttered auto plant who convinces a Japanese carmaker – the fictitious Assan Motors - to reopen the auto plant in Stevenson’s Pennsylvania hometown. Assan Motors agrees and as you might imagine – mayhem ensues.
Of course, while the film is riotously funny (okay, it’s not, but it had Norm from Cheers, so it wasn’t all bad), it had a not so hidden message - Sony had bought Columbia Pictures, Mitsubishi Estate had bought Rockefeller Center, and Japanese companies held 32 of the world’s 50 largest market capitalizations. In other words, the era of America was at an end, and the era of Japan had begun – insert funny joke. Perhaps most famously at the time - the land beneath the Imperial Palace in Tokyo was said to be worth more than all the real estate in all of California (for context, the land beneath the Palace is 0.44 square miles whereas California is more than 160k square miles).
From a stock market perspective, by 1989, Japan made up roughly 40% of the MSCI World Index and an even larger share of EAFE, the benchmark against which nearly every international money manager was measured. Closely following the index meant owning lots of Japan, and nobody ever got fired for closely tracking the benchmark.
Then the music stopped. The Nikkei fell 45% in seven months and would not see its 1989 high again for 34-years. Over the following decade, the S&P 500 returned more than 4x that of EAFE, which had been dragged down by the self-fulfilling prophecy of too much Japan. In Ho (yes, we greatly enjoy calling it this), the Americans and the Japanese eventually meet halfway, the cars roll off the line, and everybody keeps their jobs. The money managers who followed their benchmark in the late 1980s likely didn’t get their Hollywood ending.
Which brings us to today. The current state of the S&P 500 is starting to resemble those international indices of the late 1980s that were making an enormous bet on Japan. This time – it’s AI. While there are some material differences, we have grown concerned about the performance of those who choose to simply “follow the benchmark” from here. Let’s explore some history, look at where we are currently and come up with some ideas.
The TSX Fat Pitch
Roughly 15-years ago, there was a generally accepted principle amongst the Canadian-based investment community that the S&P/TSX was a broken index. Let’s take a look at a chart and then comment:
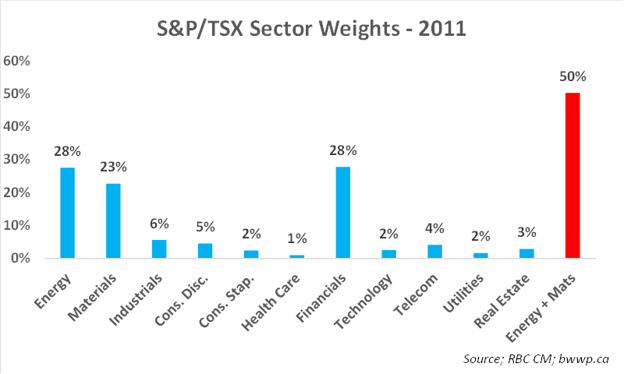
Half of the index was in Energy and Materials stocks as a 10-year commodity boom driven by years of under-investment in the 1990s and China’s entry into the World Trade Organization in 2000 shifted more and more investment weight to a narrow area of the market. Now, benchmarks matter because a lot of institutional money – mutual funds – attract investment dollars via their ability to beat the benchmark.
Most fund managers, who are graded on what we would call “the benchmark curve”, are generally loathe to stray too far from the benchmark, as a “bad bet” or two could mean significant underperformance relative to the benchmark, which in turn could lead to investors pulling their money out, which in turn could lead to loss of job security. Thus, despite ~50% of every dollar going toward Energy and Materials, which fundamentally felt wrong to most professional money managers at the time, it was still a relatively common practice.
The next decade would not prove kind to Energy and Materials. High prices tend to attract over-investment, and this usually happens at the same time that demand, which in this case was driven by the massive urbanization of the Chinese economy, starts to slow (you can only build so many cities with no one living in them after all). Let’s look at what the TSX looked like by 2020:
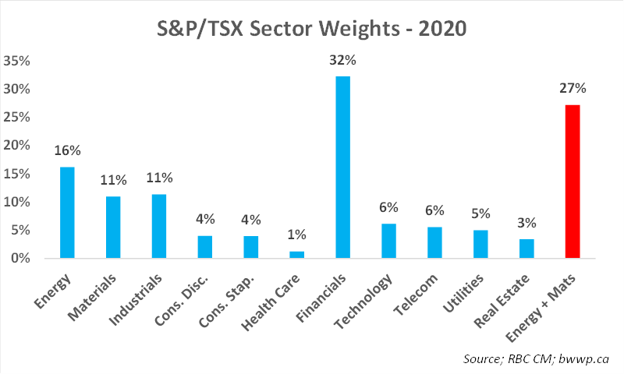
Not surprisingly, Energy and Materials underperformed and the weighting returned to a much more justifiable and sustainable level. Now, returning to 2011 for a moment, we used to say at the time that someone living in Niagara Falls, Canada and who invested in a Canadian mutual fund that benchmarked to the TSX was likely putting close to half of every dollar into Energy and Materials, while someone living in Niagara Falls, NY, who invested in a U.S. mutual fund that benchmarked to the S&P 500, would have had their investment dollars spread around like this:
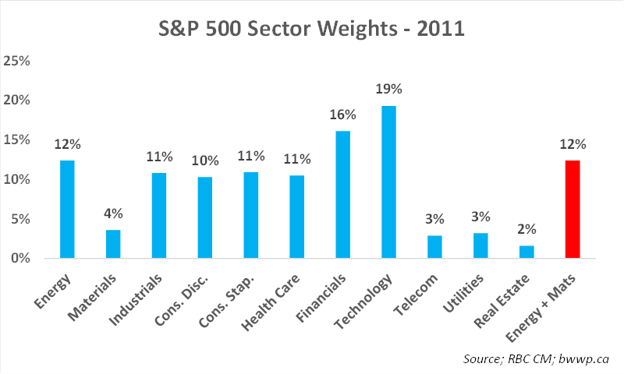
Of course, this makes little sense – why would five-miles as the crow flies mean that one investor puts 50% of their money into Energy and Materials, while another investor puts 12%? So, the argument we made in RBC Wealth at the time was – if you don’t have to benchmark, well then, don’t follow the benchmark. Let’s add another chart and then comment:
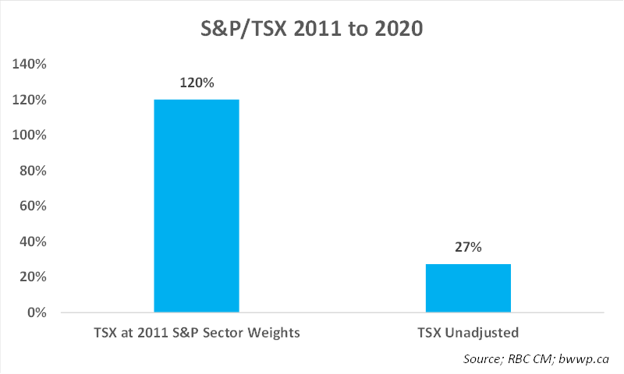
If our Niagara Falls, Canada investor had simply invested in Canadian stocks but weighted his/her portfolio using the S&P 500 sector weights, his/her return would have been ~93% better over the period.
The Internet Bubble
Now, while it may seem as though we are picking on the TSX, the reality is that we have seen these kinds of extreme concentration shifts before and in other indices. Let’s take a look at the S&P 500 circa 2000:
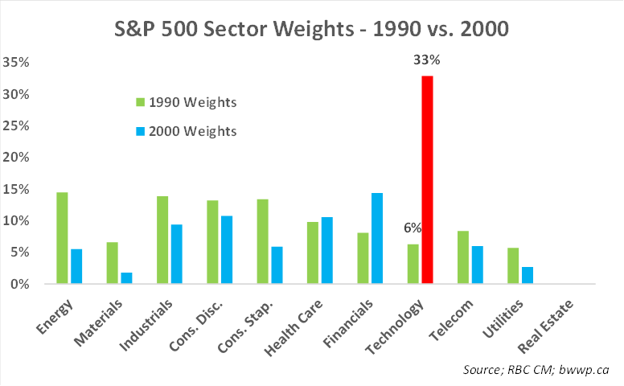
Coming out of the 1990’s and the Internet boom, Technology had grown from relatively small part of the index in 1990 – ~6% - to roughly 1/3rd of the index by 2000. We want to be clear - this was not about being some sort of investment guru in 2000 who knew that the Internet bubble was about to burst. Rather, at the time, one who did not have to follow the benchmark might have simply said – putting 1/3rd of every dollar into technology stocks is a dangerous practice and I am not going to take on that risk, despite what the benchmark might indicate. Rather, let’s say instead one had said – I am going to take the average weight of technology over the prior five years - ~14% of the index – and allocate that to the sector and take the remaining weight - ~19% - and allocate it across the other sectors equally (in other words, buy a lot less tech and a little more of everything else). What would that have looked like over the next decade vs. the benchmark?
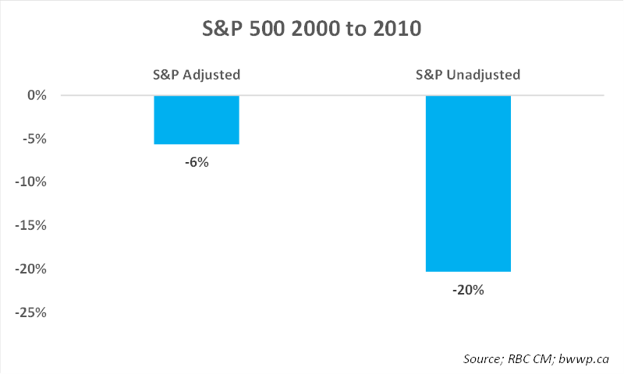
Now, we grant you that neither is particularly great as it was a tough period to invest – but there is still a ~14% gap in performance over the period. Further, we did not put any thought into where to distribute the technology weight; if we had, for example, taken the 19% and redistributed it to the three sectors that had seen the biggest weighting declines over the prior decade – Energy, Materials and Consumer Staples – the return would have been ~+4% (or 24% better than the benchmark) from 2000 to 2010.
Thinking about the S&P 500 today
There is no shortage of articles out there today that posit that active money management is dead. This is largely because the S&P 500 has performed remarkably well over the past ~15-years and most active managers have struggled to keep pace. But it’s not about where we have been, but rather where the index finds itself now. Let’s add another chart and then comment:
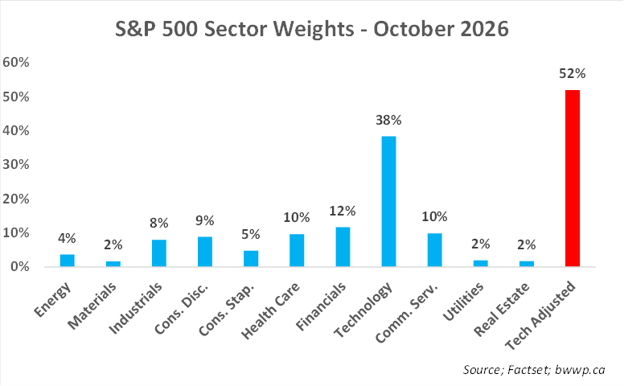
Technology now sits at more than 38% of the index. But this does not even do it full justice as adjustments made to the index back in 2018 moved stocks such as Alphabet and Meta from the Technology sector to a newly created sector called “Communication Services”. If we add these names and others such as Amazon and Tesla, which tend to be part of the same trade as Technology, to the true weight of Technology in the index and more than $0.50 of every dollar that it put into the S&P 500 is essentially going into technology. The funny thing is, this reminds us a bit of another index extreme that we did not mention above, but we will bring up now – for a brief time in the year 2000, Waterloo, Ontario-based tech company Nortel Networks soared to the moon. Nortel became so big that in August of 2000, the Technology sector in Canada hit nearly 44% of the index (Nortel would ultimately file for bankruptcy less than a decade later).
And while we are not trying too hard to compare the current state of the S&P 500 to the TSX circa mid-2000, we would note that until the current S&P 500 saw such a great concentration in one sector, the Technology weight in Canada for that fleeting period was the highest sector weight for either the S&P/TSX or the S&P 500 over the past 50-years. Let’s look at another chart and then comment:
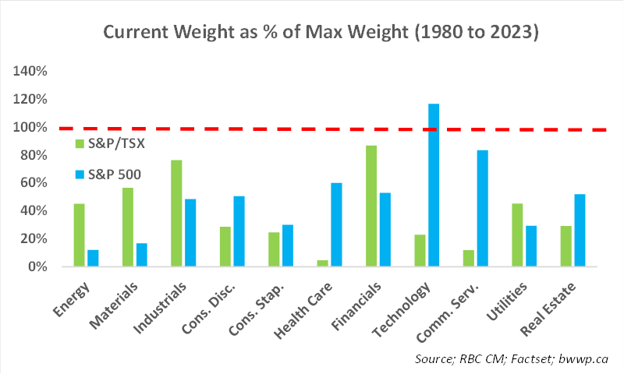
Here we have taken each current sector’s weight (for both the TSX and S&P 500) vs. the maximum each sector reached from 1980 through 2023. We would note that only U.S. Technology is more than 100% its prior max and this is before we add back the aforementioned weights in some former tech darlings.
A Quick Note on Passive Investing
The above has been made possible, in part, by the massive rise of passive investing via exchange traded funds (ETFs) and passive mutual funds. These vehicles are designed to mimic an index as opposed to taking a view on specific securities. Passive strategies now hold nearly $18 trillion globally and account for more than 100% of new investment dollars to the market (active investing is seeing outflows). Many of these passive strategies are powered by machines that add and subtract exposure from the market based on moment-by-moment technical indicators.
This structure creates as sort of self-reinforcing mechanism - index concentration lifts the largest stocks - the largest stocks lift the index - active managers who are underweight the giants on valuation grounds (as well as simply managing risk grounds) fall behind - their clients read that passive beats active, redeem, and buy an index fund – the index fund buys more of the giants. Each turn of the wheel strengthens the story that indexing is the only rational choice, at precisely the moment when the index is least diversified and at its most dangerous.
We would add that choosing the S&P 500 is itself an active decision. It is a decision to own 500 large US companies in proportion to their recent success. In ordinary times, that makes perfect sense; however, at a time when one theme makes up half the index, it is a concentrated bet wearing a diversified label.
Final Thoughts: The Re-Rise of Active Management?
As with Japan in the 1980s, Technology circa 2000 and the ebbs and flows of the weight of commodities in the TSX, there are times when the obvious is staring you right in the face. The AI story has massive potential that may be on a par with Industrial Revolution. But at more than 50% of the S&P 500, we believe that technology has simply become too big of a bet for any prudent money manager to follow. This does not mean that we advocate having no weight in one’s portfolio to the AI food chain, but prudent risk management (and common sense) would argue that putting $0.50 of every dollar into technology has a high likelihood of both poor absolute performance and heightened volatility over the next decade.
As we have said, it is a powerful elixir for money managers who are benchmarked to the S&P 500 to simply closely follow the index. The career risk of diverging is simply too great. But we are highly confident that the next decade will be unkind to passive indexing as history has taught us again and again that large skews in weighting inevitably mean revert toward long-term averages. As such, while we will not ignore AI as there are many good businesses that will likely give us opportunities to buy/add to them at good prices, our approach will be not to worry about the index weights, but rather where the opportunities lie, which we suspect will look drastically different than a 50%+ weighting in technology.