Cushing Private Wealth
July 19, 2026
There’s a little parlour game being played on Wall Street at the moment: it’s called “pick which year of the late 90s the stock market is currently re-living”. To wit, Evercore’s strategist says the rally feels like 1999, with “relatives, friends, doctors, Uber drivers” all talking about AI stocks. Veteran chip analyst Dan Niles counters that it is really 1997 – year three of an infrastructure buildout with plenty of runway left. Deutsche Bank, apparently deciding that one year wasn’t enough, described 2026 as “1999 meets 1990, but hopefully not 1973.” How about you – got a guess?
It is easy to understand the urge to reach for the certainty of history, because the quarter we just finished was an uncommon one, even by recent standards. After a rough Q1 that saw the US forcibly remove the leader of Venezuela, the Iran conflict erupt, the Strait of Hormuz get closed, and oil shoot well over $100/bbl, what did the S&P 500 do? It promptly delivered a double-digit quarterly gain, led by a searing rally in semiconductor stocks. The rally was the market’s strongest quarter since the pandemic rebound of 2020, and in an unintentional nod to the tech bubble, it even included a record-breaking IPO with SpaceX listing at the valuation of a cool US$1.8 trillion. To round it off, the last two weeks of June served up genuine fireworks with Korea’s semiconductor-heavy stock exchange halted limit-down twice in a single week, and some AI-darlings like Oracle closing out with their worst week since…well, since the dot-com bubble.
So which year is it? We here at Cushing Private Wealth Partners aren’t big into parlour games. But the question everyone’s really asking, of course, is whether we’re in a market bubble like the one that popped in March 2000. There’s no doubt that some individual stocks are now swinging around in a manner that rhymes with the late 1990s, but to us the current environment looks like one where an investor needs to attentively watch the gauges, not nervously eye the exits.
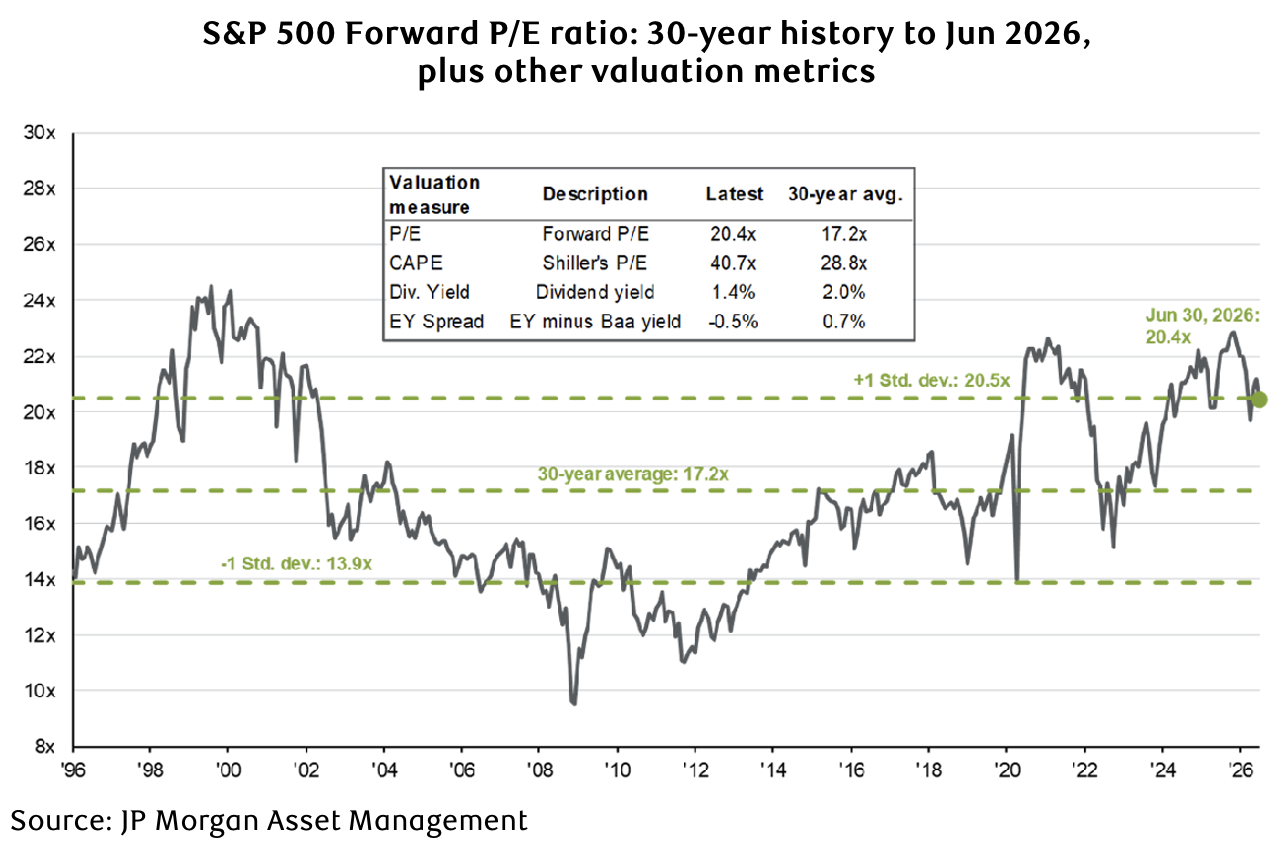
Which gauges? Well, let’s start with the most basic of bubble tests: how much prices are running ahead of profits. Here the data is clear. The S&P 500 entered this year trading at about 22x forward earnings – which is to say it was not quite at the nosebleed levels of the late 90s, but it was amongst its most expensive starting points on record. And yet, while it gained 9% in the first half of 2026 and set new all-time highs, today it trades at a lower multiple of about 20x. That’s only modestly above its 10-year average, and is in the zone of one standard deviation relative to its 30-year average. Read that again: the market has both gone up in 2026 and become cheaper. This is not what bubbles do. Bubbles are defined by multiple expansion; in the dot-com era, the vast majority of the tech sector's gains came from investors paying ever-higher prices for the same dollar of earnings (or in many cases, for no earnings). By contrast, through the first half of this year the S&P 500 has become cheaper as earnings growth has done the heavy lifting.
The earnings really have been remarkable. Q1 profits for the S&P 500 grew a staggering 29% year-over-year on 12% revenue growth. Wall Street analysts have subsequently raised their 2026 estimates, bucking the typical pattern of starting with optimistic projections and slowly trimming those as the year progresses (for example, the 10-year average analyst estimate revision is -2.7%). Those of you who actively read Street Savvy in the past may recall that the last time we saw earnings estimates increase intra-quarter like this was five years ago, as we emerged from COVID into the powerful market rally of 2021. The same structural set-up is in place now, but on a much larger scale, and without being sugar-induced by free government cheques and 0% interest rates.
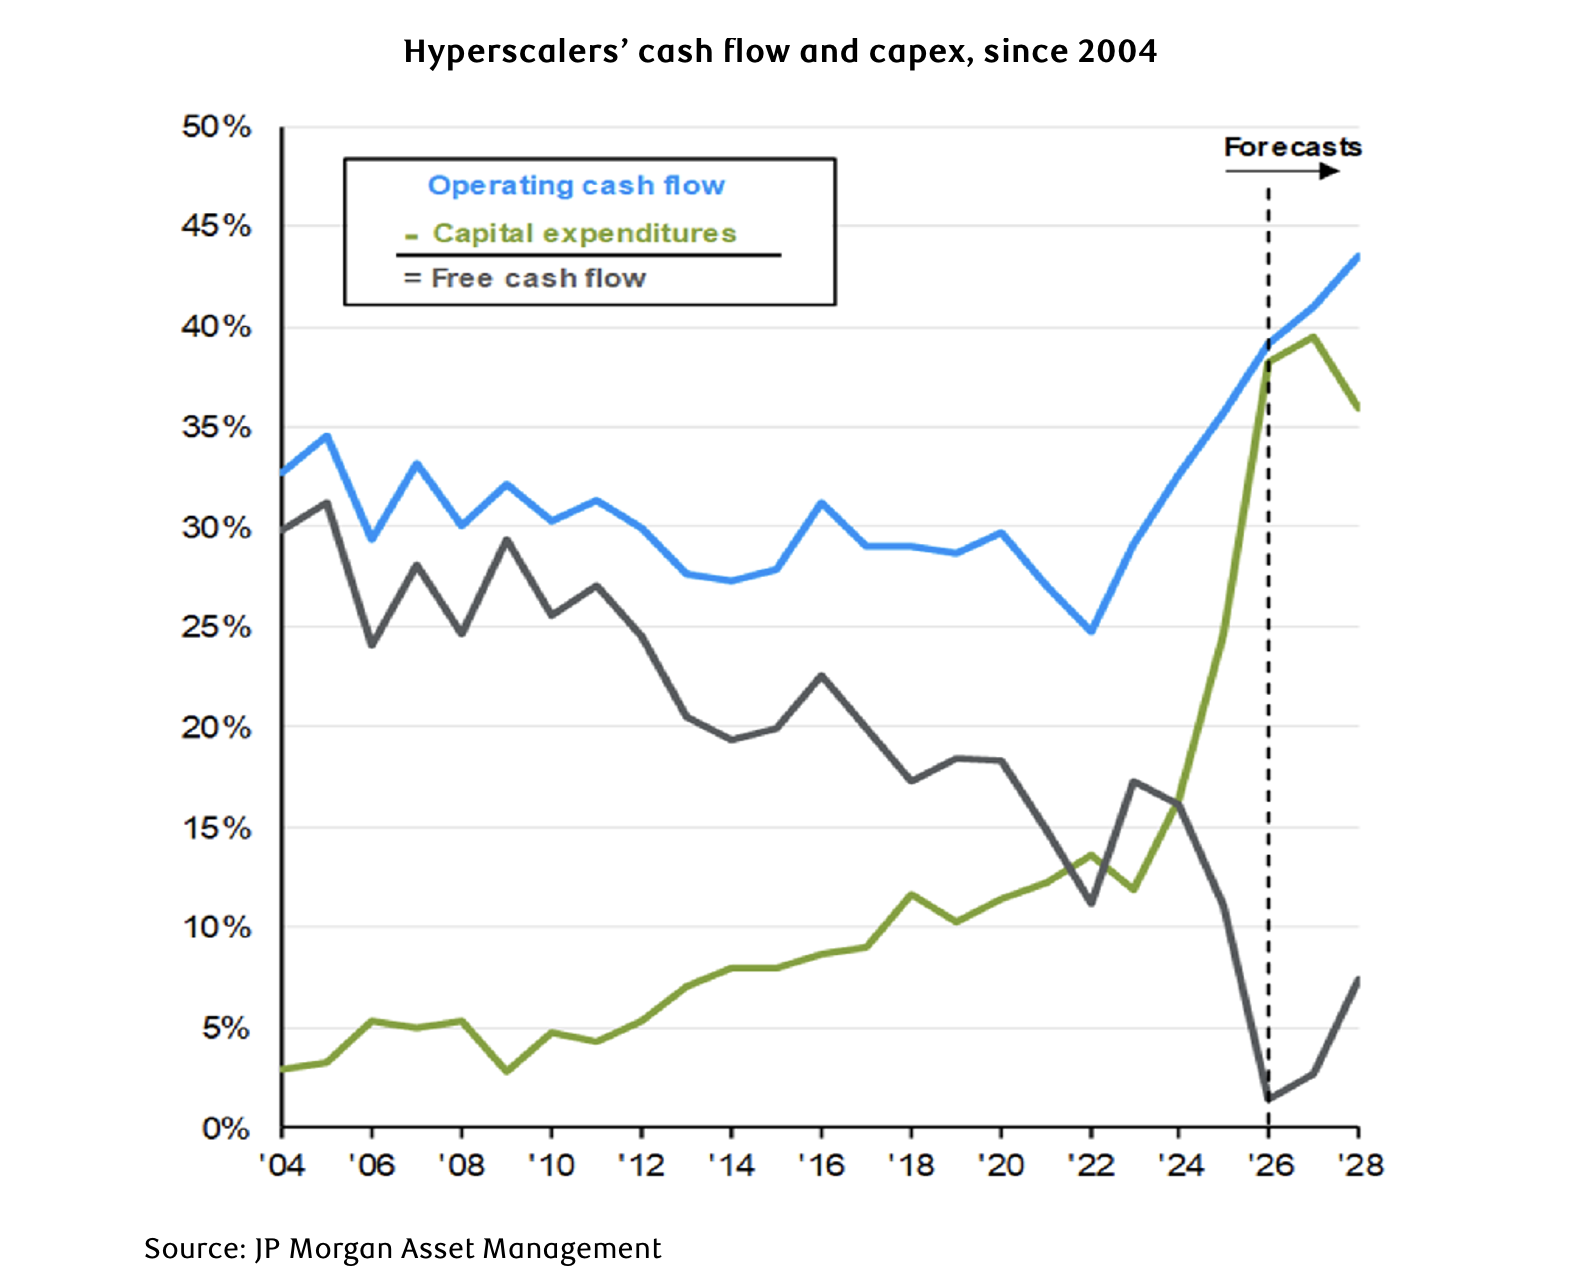
When numbers seem surprising in investing, it is always worth a quick sanity check. Intuitively, does this earnings growth make sense? Zooming out, the largest companies in the world spent a decade accumulating an enormous annual pool of operating cash flow with nowhere ambitious to spend it. In the past 24-36 months, they’ve found the outlet in AI. Hyperscalers (i.e. Google, Microsoft, etc.) are on pace to spend $750 billion this year, up from “only” $150 billion of total capex just three years ago. That spending lands directly on the income statements of the companies supplying AI chips, memory, power, and construction…and in turn, it lands on the income statements of those companies’ suppliers, and so on. If you add $600 billion of revenue to income statements, flow it through to earnings and apply a multiple, the arithmetic implies trillions of dollars of added market capitalization – which is precisely what we've seen. The sanity check clears.
Another gauge to watch is market breadth. An infamous feature of the late-1990s bubble was that the party kept narrowing – fewer and fewer stocks carried the index, while the average stock quietly rolled over. Today the opposite is happening: as of the end of June, small caps, the equal-weight S&P 500, and value benchmarks have all made new record highs. Industrials – hardly a speculative fever-dream sector – are the top performer year-to-date. A market with broadening strength is generally a healthy market.
Other gauges include credit markets (corporate bond spreads steadily widened in the late 90s whereas today they’re almost at the tightest on record), inflation expectations (ticked up in Q2, but interest rates adjusted and oil prices are now reverting) and also whether the business case for all this spending is even justified. That last point is probably an entire update on its own, but for now, suffice to say that Anthropic’s revenue has gone from essentially $0 in 2023 to a disclosed annual run-rate of almost $50 billion as of last month. For context, that’s the same amount as Coca-Cola, but achieved in just 3 years rather than over a 140-year history. Clearly there’s some sort of business case here.
Which brings us back to the parlour game. Our job isn’t to guess the year, but rather to watch the gauges that have flagged trouble in the past. Putting the pieces together – earnings up, spending up, P/E multiple lower, strong market breadth, credit and IPO markets open, central banks being patient – and the picture that emerges is a positive investing environment. There are always risks and no doubt we’ll feel some bumps through summer, possibly from geopolitical issues and almost certainly from tariff news re-emerging as Section 232 investigations conclude. All things equal though, this summer looks like a period to both enjoy some sun and enjoy the ride.