Elizabeth (Libby) Hunter
Senior Investment & Wealth Advisor
February 16, 2026
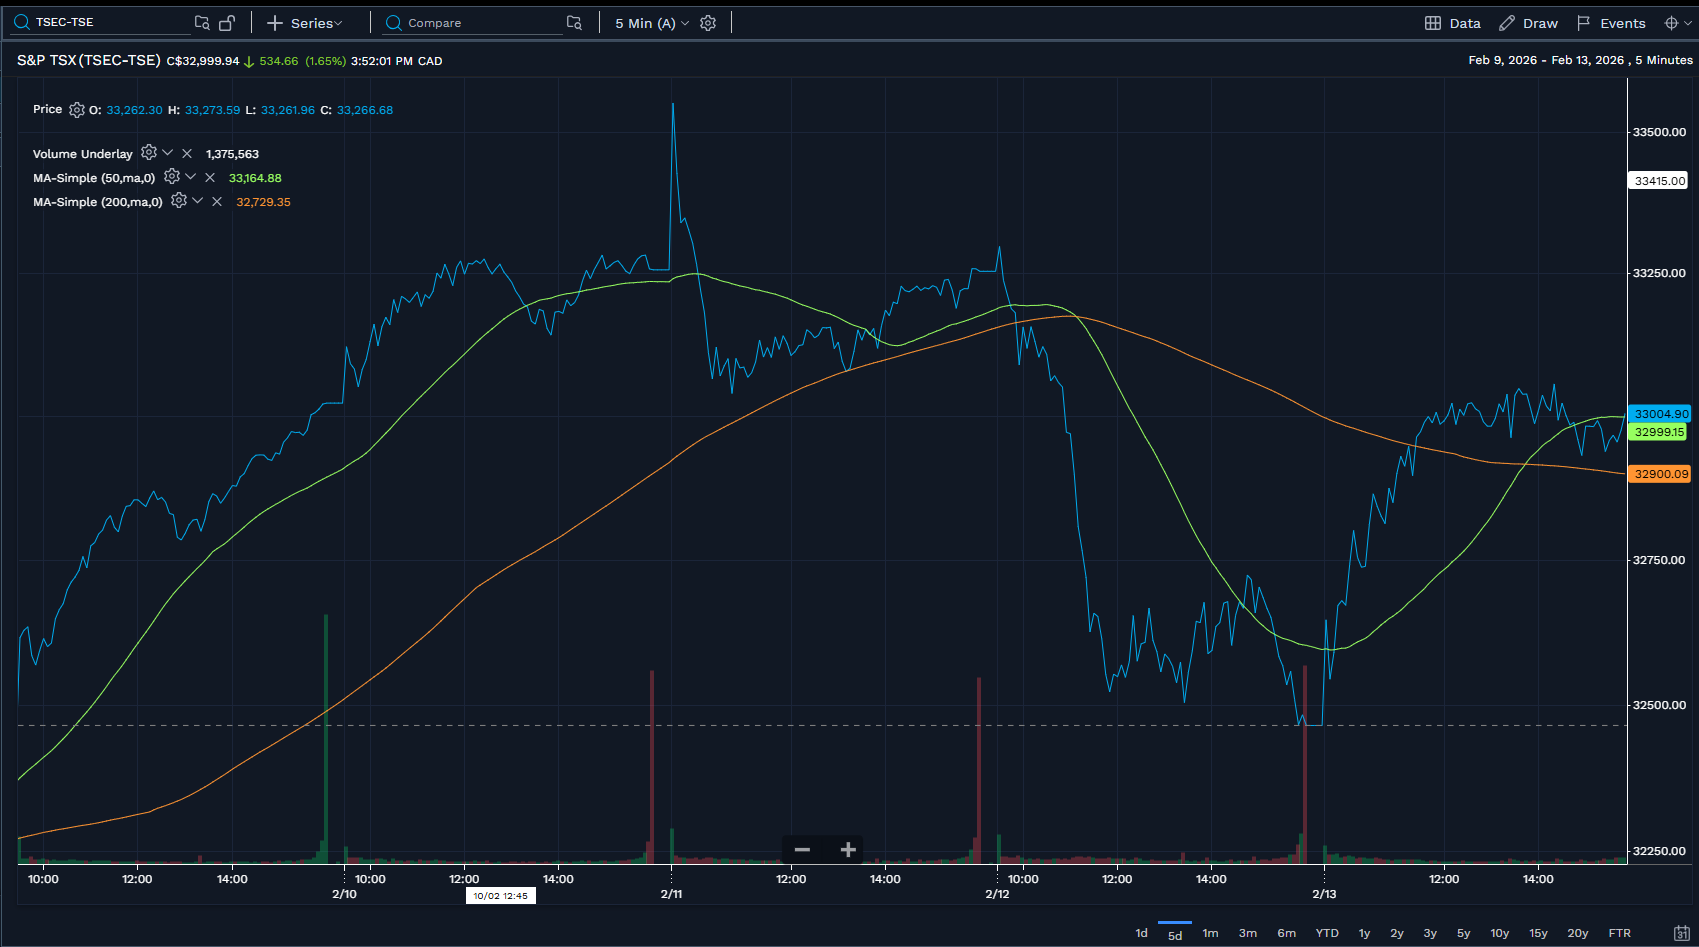
If you take a look at the blue line in the graphic at the bottom of this page, you’d be forgiven for thinking it was a chart of the market action during 2020. Would it surprise you to know that it’s only the 5 trading days from last week?
If we isolate this past Thursday, professionals in my industry would call it “a down day.” The financial media however spun it in their predictable fashion, which, if you believed everything you might have read or watched, it was something closer to a meltdown.
I’m directly quoting from Bloomberg here, in relation to Feb 12th: “Prices buckled across several asset classes with concern about tech sending stocks down the most in over three weeks”.
This is what actually happened on that day:
∙ The S&P 500 dropped 1.57%
∙ The TSX fell 2.37%
∙ Markets did what markets do
Here’s some additional context that’s worth remembering — these days, a 2% drop qualifies as “normal volatility” by any measure. It’s market noise. Yet scan the headlines and you’d think we’d witnessed a financial apocalypse. The TSX falling 789 points sounds dire, until you remember it was sitting near all-time highs. Down 2.37% from record territory is not the same as an economic collapse.
This is the circus we’ve been discussing for years. Traders turned their attention to inflation data while an AI selloff “lost steam” — which is business-speak for “people took profits and moved on.” But “lost steam” doesn’t inflame the imagination, nor does it sell advertising space .
If we look back to this time last year, both the US and Canadian markets endured steep corrections amid pervasive tariff and economic uncertainty, yet they still ended the year up 18% and 32%, respectively. Historically, intra-year pullbacks have averaged around 15%, with roughly six in 10 years seeing a peak-to-trough drop of at least 10%. Rather than viewing these declines as unusual, it’s helpful to see them as a normal part of the market cycle. Despite this recurring volatility, the S&P 500 and S&P/TSX Composite have generated positive annual total returns approximately 70% of the time since 1980 and 1928, respectively.
It bears repeating that your portfolios remain appropriately allocated, as determined by your long-term goals and risk tolerance.
All of the above being said, I am very pleased to say that none of my clients are prone to overreacting to the 24-hour news cycle (thank you!), but in the event you do find yourself tempted to react to the headlines, always remember this — the professionals writing them need you to click and/or watch.
Thank you for your continued trust in my management of your portfolio and here’s to getting through the rest of February!
Libby
As a reminder, if someone you know could benefit from a second opinion and fresh perspective, it costs nothing and can be invaluable for those who feel they’re not getting the care and attention they deserve. Please pass along my contact information to them. Thank you!
*Source: FactSet