Michael Capobianco
April 23, 2026
Good Morning,
Many investors are likely experiencing whiplash in equity markets as the S&P 500 surged 13 % over the past few weeks following a 10 % correction in Q1 2026.
With near-term technical indicators tracking two-to-four-week swings now back to overbought territory—signaling a pending pause or pullback—investors are understandably questioning whether the rebound is sustainable.
While valuations, the war in Iran and its effect on inflation, and global growth remain ongoing fundamental concerns, we see two technical reasons to remain cautiously optimistic moving through Q2 2026.
First, participation remains positive. Breadth of participation, as measured by advance-decline lines, remains positive with the S&P 500 and NYSE advance-decline lines at or near new highs. Equity cycles don’t usually peak when participation is broad with advance decline lines at or near all-time highs.
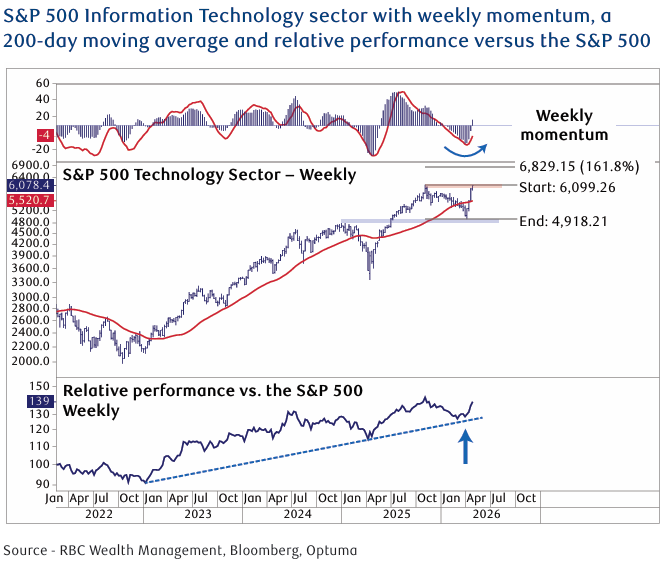
The largest sector in the market, Technology, is accelerating following a Q4 2025–Q1 2026 correction. More importantly, with the Information Technology (35 %) and Communication Services (12 %) sectors accounting for just under 50 % of the S&P 500’s market capitalization, their direction will define the overall trend of the S&P 500.
The first technical observation is that the weekly momentum indicators have turned up from oversold levels, which developed through Q4 2025 and into late Q1 2026 as growth stocks sold off. This is a potential catalyst for a rotation back to growth stocks.
With that indicator now early in an upturn, we expect further upside through the quarter. Markets have turned up from oversold levels, which developed through Q4 2025 and into late Q1 2026 as growth stocks sold off.
Secondly, although the Technology sector’s price has surged back to resistance at the Q1 2026 highs—where a near-term pause is likely—the overall trend of higher lows and higher highs remains intact.
A breakout above 6,100 would be supportive of further upside to the 162 % extension level near 6,800 numbers.
Relative trend remains positive.
The overall trend of the Technology sector’s relative performance versus the S&P 500 remains intact with the Q4 2025–Q1 2026 pullback bottoming at the uptrend line.
Put differently, until that uptrend shows evidence of turning negative, we would caution investors against turning overly bearish on the sector.
While equity markets have rebounded from oversold levels at the end of Q1, the direction of interest rates will continue to be an important catalyst for equities. The U.S. 30-year and 10-year Treasury yields illustrate that despite the war in Iran—and potential risk to supply chains and inflation—long-term interest rates remain in relatively narrow sideways trading ranges that began in Q4 2023.
What to watch for:
The U.S. 30 year yield between 5.0 % and 5.18 %, which is a particularly important technical threshold. Specifically, while risk assets such as stocks appear to be discounting a positive resolution to the Iran war.
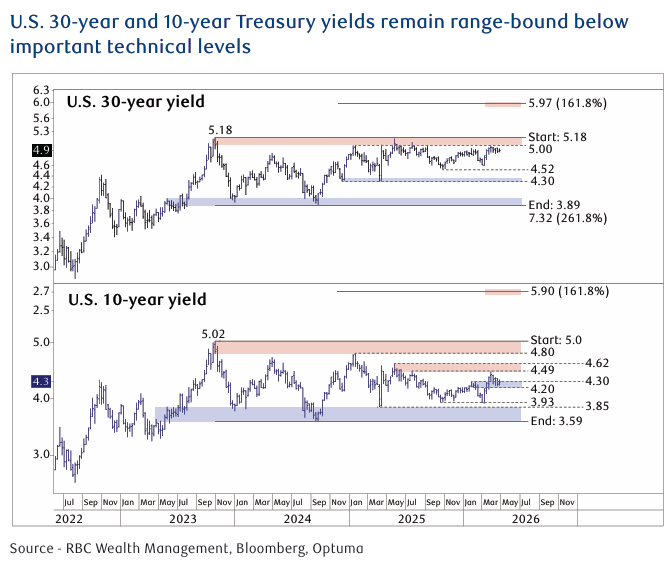
A move by the U.S. 30-year yield above the upper band to be an important signal that investors are viewing inflation as an accelerating risk and a potential catalyst for the equity cycle that began in Q4 2022 to peak.
The bottom line technically is that we expect U.S. long term interest rates to remain in their broad trading ranges through Q2.
If you have any questions or comments, please feel free to let me know.
Many Thanks,