Nick Milau
August 20, 2026
Weekly Wrap
Stocks came off the boil this week, giving back some of August’s gains. The TSX was down 0.5% this week, though it is still up 3.7% in August. Fun fact: the entire amount of the TSX gain in August is from the Materials sector (AKA Gold stocks). Gold is up 13% on the month and our gold heavy index has benefitted. US stocks are down 1.5% this week as investors fretted over multi-decade high bond yields while waiting anxiously for news of a trade deal with Canada. Interest rates in North America crept up around 0.1% this week as investors are not impressed with government borrowing and spending activities (among other things). EU stocks are down 0.6% while the Emerging Markets are off 0.2%. Oil prices are up 5% this week as there remains no progress on the Strait of Hormuz; this news and hopes for a Canada/US trade deal pushed the Loonie is up 1% versus the US Dollar.
Market Insights
Bonds got all of the attention this week! US bond yields are at 19-year highs with investors citing a slew of reasons, including the Middle East conflict, higher inflation, and a wave of tech-company bonds for the downturn. Thirty-year US Treasury bond yields topped 5.3% for the first time since 2007. Publicly-held US debt is now at 100% of GDP, nearing levels last seen during World War II. Higher yields are certain to contribute to raising US mortgage rates, adding to Americans’ cost of living woes. But the US is not the only country with a rising rate concern. In Japan, 10-year yields climbed to a three-decade high (just below 3% now) amid persistent inflation and expectations for further BoJ tightening, while German, French, and UK long-term yields also moved sharply higher. Some investors (including me) view current yield levels as increasingly compelling and potentially supportive of bond prices over the medium term. But at the economic level this is a concern; the problem has grown so much that the US government is now intervening in several bond markets to keep a lid on rates including the US, Japanese and German bond yields. Even if you’re not a bond investor, you best pay attention to what is happening in the bond market…borrowing fuels the stock market and the economy and the cost of this fuel continues to rise.
Quarterly Earnings in your rear-view mirror may appear larger than they are. Following a tremendous quarter of earnings, investors had best take note that a good portion of recent ‘earnings’ are merely gains on stock portfolios held by US companies (otherwise known as ‘non-operating’ earnings)…particularly the Mag 7 tech stocks. In fact, non-operating profits for the S&P 500 for the four quarters ending in Q1 2026 was up 120% from Q1 2025. Operating income (actual profit from business operations), meanwhile, was up 10.5% over the same time frame. To be fair, this 10.5% gain is still above the longer-term average of 7.2% and is impressive in its own right. However, non-operating EPS as a proportion of income has reached its highest percentage since Q3 1991. A large share of this non-operating income comes from the largest stocks: Mag 7 companies made $105 billion from non-operating activities in the four quarters ending Q1 2026 versus $112 billion by the remaining (non-magnificent) 493. The concern is this: stocks are priced on future earnings estimates so investors are being naive if they say US stocks (and the Mag 7 in particular) are ‘reasonably valued’. This is because unrealized stock gains do not go up in a steady manner and thus can’t be counted on as a source of recurring profit to formulate earnings growth predictions. Gains on investments can even turn into losses (sorry…not can…they will turn into losses at some point). When valuing stocks based on future earnings, the non-operating earnings should be excluded and thus recent earnings growth is not as large as it appears, nor will it continue at this rate.
Portfolio Update
This week we took profits on one of our Brookfield Corp preferred shares (BN.PF.F). Not all of you owned this pref, but most do own either this pref or another BN pref with similar features. This pref was sold about 3% above its call price (the price at which BN has the right to repurchase it on September 30, 2029). While the pref pays a 5.7% dividend, which is attractive, the likelihood of the pref being called is high meaning you would lose the 3% premium over the remaining 3 years. If you owned it until then it would leave you with about a 4.7% net annual return if it is called. We feel this is not a high enough return when compared to other, less risky, fixed income options. Further, in the event the pref does not get called, the pref would likely fall 10-15% which, needless to say, is a risk we would like to eliminate. For those of you who owned it, in addition to the 6% annual dividend the pref also tacked on an average capital gain of 25% to 30%.
Please note any changes apply to our PIM Portfolios Only, subject to restrictions. Please call to clarify if you have any questions.
Planning On
Understanding Return of Capital in Mutual Funds
Return of capital funds have found a place amongst the Canadian financial institutions as a way of providing cash flow to clients. They are not, however, able to manage income and distributions in the same way that we can with your non-registered portfolios. This week I thought we would dive into what this means for those who hold them.
What is Return of Capital?
Return of Capital is a distribution where the fund returns a portion of your original investment to you as cash flow—not income. This is a critical distinction many investors miss. Unlike dividends or interest, which represent earnings, ROC is simply returning your own money. This typically happens when a fund pays out more cash than it has generated through income or gains, which is often the case. Many have a 5% payout and that is a lot to ask a fund to produce 5% of income for a balanced portfolio of stocks and bonds. Capital gains, in some years, may help reach that 5%. Some payout funds aim for a much higher rate of distribution….7% or higher. In those funds, there is almost certainly going to be ROC annually.
How It Works
When you receive an ROC distribution, it's not taxed as income that year. Instead, it reduces your cost basis (the adjusted value of your investment). For example, if you invested $5,000 at $50 per share and received $300 in ROC, your cost basis drops to $4,700. This is where it gets important: when you eventually sell, any gains are calculated from this lower basis, potentially triggering a larger capital gains tax bill down the road.
A Key Disadvantage: You Can't Customize ROC
Here's the kicker—if a fund distributes via ROC and you don't need that cash flow, you're at a tax disadvantage over time. With ROC, your cost basis erodes annually whether you need the cash or not, resulting in deferred but eventually realized capital gains taxes. In contrast, if you were drawing from a non-registered account managed by us and your monthly withdrawal doesn’t exceed income, there may be no ROC and, even if there is, you'd manage tax implications annually and have more control vs down the road where the tax implications may be much greater.
Theoretically speaking, if the funds paid a large amount of ROC over time, the cost base could hit zero – where you have received all your invested capital back. If this were to ever happen (and it is unlikely), any additional ROC distributed becomes immediately taxable as a capital gain and is no longer deferred.
Like all mutual funds, payout funds have their place in the financial landscape, but for those with more substantial amounts, they may not be the best strategy. ROC distributions aren't inherently good or bad—they're simply a different type of cash flow. The key is understanding whether the fund's distributions are sustainable and how they align with your investment goals.
This information is not intended to provide legal, tax, or insurance advice. To ensure that your own circumstances have been properly considered and that action is taken based on the latest information available, you should obtain professional advice from a qualified lawyer or accountant, as applicable, before acting on any of the information.
Updates from the Team
Walk & Roll for UNITI Update
In support of UNITI’s programs that help local people with disabilities connect, thrive and belong, the Milau family will be walking alongside UNITI on Saturday, September 26th. So far, Team Milau has raised $17,625!
Charts of the Week
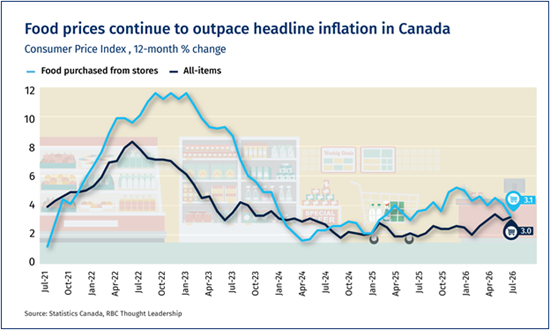
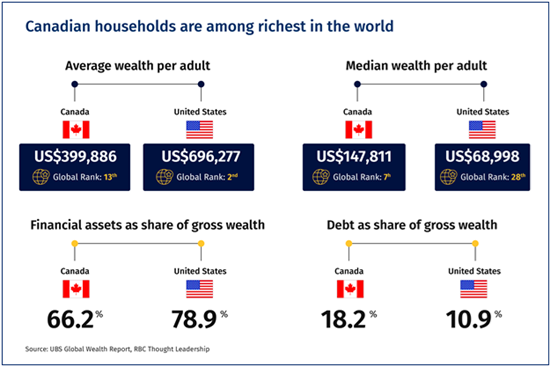
Feel free to share this newsletter with anyone who might benefit from it or find value in it. Thank you for reading our commentary. We welcome your feedback!
Return to homepage
This information is not investment advice and should be used only in conjunction with a discussion with your RBC Dominion Securities Inc. Investment Advisor. This will ensure that your own circumstances have been considered properly and that any action is taken based upon the latest available information. The strategies and advice in this report are provided for general guidance. Readers should consult their own Investment Advisor when planning to implement a strategy. Interest rates, market conditions, special offers, tax rulings, and other investment factors are subject to change. The information contained herein has been obtained from sources believed to be reliable at the time obtained but neither RBC Dominion Securities Inc. nor its employees, agents, or information suppliers can guarantee its accuracy or completeness. This report is not and under no circumstances is to be construed as an offer to sell or the solicitation of an offer to buy any securities. This report is furnished on the basis and understanding that neither RBC Dominion Securities Inc. nor its employees, agents, or information suppliers is to be under any responsibility or liability whatsoever in respect thereof. The inventories of RBC Dominion Securities Inc. may from time to time include securities mentioned herein. This publication is for information purposes only. Graphs and charts are used for illustrative purposes only and do not reflect future values or changes. Past performance is not indicative of future returns. This commentary is based on information that is believed to be accurate at the time of writing and is subject to change. All opinions and estimates contained in this report constitute RBC Dominion Securities Inc.'s judgment as of the date of this report, are subject to change without notice and are provided in good faith but without legal responsibility. Interest rates, market conditions and other investment factors are subject to change. Past performance may not be repeated. The information provided is intended only to illustrate certain historical returns and is not intended to reflect future values or returns. This publication is not intended as nor does it constitute tax or legal advice. Readers should consult their own lawyer, accountant or other professional advisor when planning to implement a strategy. Insurance products are offered through RBC Wealth Management Financial Services Inc.("RBC WMFS"), a subsidiary of RBC Dominion Securities Inc.* RBC WMFS is licensed as a financial services firm in the province of Quebec. When providing insurance products in all provinces except Quebec, Investment Advisors are acting as Insurance Representatives of RBC WMFS. In Quebec, Investment Advisors and Estate Planning Specialists are acting as Financial Security Advisors of RBC WMFS. RBC Dominion Securities Inc., RBC WMFS and Royal Bank of Canada are separate corporate entities which are affiliated. *Member-Canadian Investor Protection Fund. RBC Dominion Securities Inc. and RBC WMFS are member companies of RBC Wealth Management, a business segment of Royal Bank of Canada. â / ™ Trademark(s) of Royal Bank of Canada. Used under license.
RBC Dominion Securities Inc. 2026 All rights reserved.