
Mike Morgan, CFP, CIM
Portfolio Manager & Wealth Advisor, Financial Planner
September 24, 2026
When the RRSP and TFSA Are Full
What an insured retirement plan actually looks like over fifty years, followed through one business owner, on a real illustration.
Paul is 50. His company had its best year, his RRSP and TFSA were topped up in January, and his accountant has just shown him the line that bothers him most on the corporate return: the tax on the company's investment account. The money he left in the business to be prudent earned income, and just over half of that income went to tax. Some of it comes back when the company pays him a taxable dividend. The rest is gone, and it will happen again next year.
Paul is hypothetical; the tax line on his return is not. Once the registered accounts are full, surplus in a corporation tends to sit in an investment account that is taxed every year, and eventually it has to come out through a dividend that is taxed again. An insured retirement plan is a different place to put that surplus. The simplest way I can describe it is that corporate-owned whole life insurance behaves like an account with an unusually good exit.
What follows is not a sketch. The policy values below come from a current illustration on a real product, for a 50-year-old Ontario man in good health, at the insurer's dividend scale as it stands today. Every assumption is listed at the end.
Age 50: the company buys the policy
Paul's company buys a participating whole life policy on his life and pays $100,000 a year for ten years, out of surplus it was going to invest anyway. That is $1 million in total. The policy starts with a death benefit of about $1.54 million, and the dividends buy paid-up additions, so both the cash value and the death benefit climb from there.
Inside the policy, growth is not taxed each year the way the corporate investment account is. That is the first advantage, and on its own it would not be enough to make this worth doing.
The cost comes early. In the illustration, the cash value is zero for the first four years and does not pass the $1 million the company paid in until Paul is 62. If there is any chance he needs that money back in the first decade, this is the wrong structure, and no amount of planning fixes it.
Age 65: the policy starts paying Paul
By 65 the policy holds $1,394,746 of cash value and a death benefit of $2,443,429. The company has not paid a premium in six years.
Now Paul starts drawing on it. He borrows $75,000 a year from a Schedule 1 bank, which lends against the policy's cash value, up to 90% of it. The company pledges the policy as collateral and guarantees the loan, and Paul pays the company a fee for that guarantee. He makes no payments. The interest, at prime plus 1% (5.45% today), is added to the loan every year.
The $75,000 arrives without personal tax, because a loan is not income. To put the same amount in his hands as a dividend at the top Ontario rate, his company would have to pay out about $123,600 as an eligible dividend, or about $143,500 as a non-eligible one.
He draws for twenty years, to age 84, for $1.5 million in total. This is the policy and the loan side by side:
Age | Cash value | Loan | Loan ÷ cash value | Death benefit |
65 | $1,394,746 | $79,088 | 6% | $2,443,429 |
70 | $1,906,326 | $544,073 | 29% | $2,970,256 |
75 | $2,561,824 | $1,150,353 | 45% | $3,595,986 |
80 | $3,380,126 | $1,940,860 | 57% | $4,354,112 |
85 | $4,385,870 | $2,892,487 | 66% | $5,271,699 |
90 | $5,558,794 | $3,771,416 | 68% | $6,351,651 |
95 | $6,908,992 | $4,917,420 | 71% | $7,564,829 |
The fourth column is the one to watch. The bank will go to 90%, and Paul's loan peaks at 73% at age 100. That gap is deliberate. At the lender's maximum, this policy would have supported about $92,000 a year instead of $75,000. The stress test below is why he left the difference on the table.
Age 90: what his family receives
Paul dies at 90. The company receives the death benefit tax-free, the bank is repaid from it, and what is left goes to his family through the company's capital dividend account.
That account is where most of the value in this strategy sits. When a corporation receives a life insurance death benefit, it credits the capital dividend account with the death benefit minus the policy's adjusted cost basis, and money paid out of that account reaches shareholders or an estate as a capital dividend, free of personal tax. The cost basis shrinks as a policy ages; this example assumes $200,000 at Paul's death.
Death benefit received by the company | $6,351,651 |
Less: loan repaid to the bank | ($3,771,416) |
Cash left for Paul's family, paid tax-free | $2,580,235 |
Capital dividend account credit ($6,351,651 less $200,000 cost basis) | $6,151,651 |
Capital dividend room left for the company's other surplus | $3,571,416 |
Look at the last line. The capital dividend credit is based on the full death benefit, not on the cash left after the bank is repaid, so the company still has about $3.57 million of room to pay out its other surplus, including the investment account that started this conversation, with no personal tax.
Add it up. The company paid $1 million in premiums. Paul took $1.5 million out in retirement without personal tax. His family received $2.58 million without personal tax, and the company can move another $3.57 million out the same way.
What return is that, really?
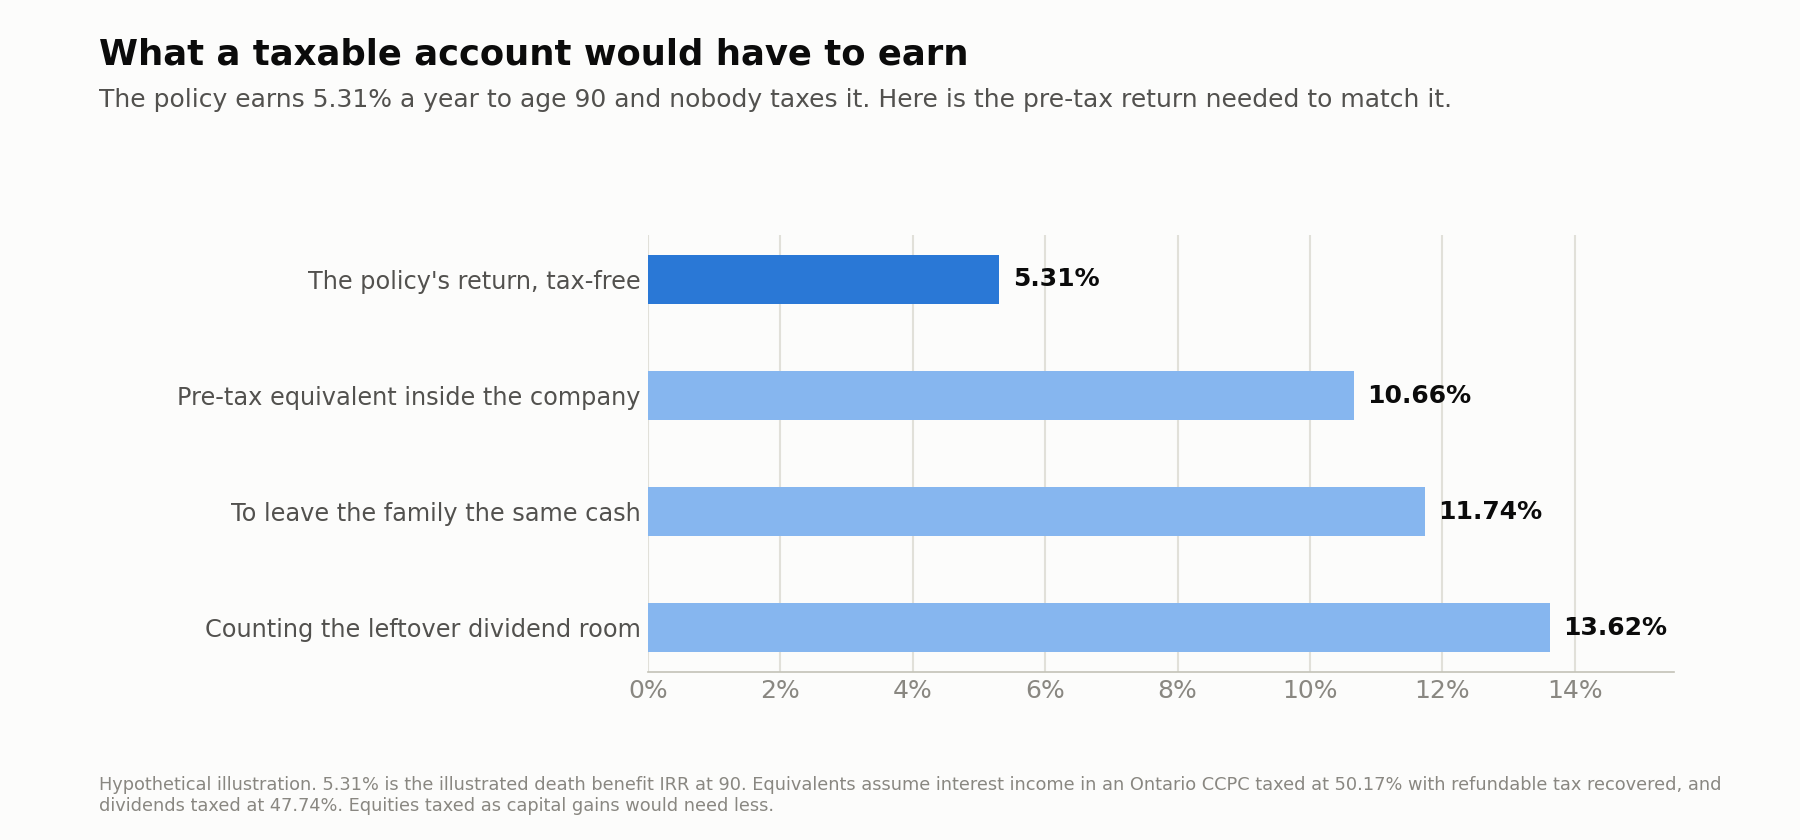
The illustration reports a rate of return on the death benefit: 5.31% a year if Paul dies at 90. On its own that number understates what happened, because it is a tax-free return. Nothing was paid on the growth inside the policy, the death benefit reached the company tax-free, and the capital dividend account carried it to the family tax-free.
Comparing 5.31% with the return on a taxable portfolio is not a fair comparison. The fair question is what a taxable alternative would have to earn, before tax, to finish in the same place. Inside the company, investment income is taxed at just over 50% in Ontario, so the equivalent looks like this:
Paul dies at | Illustrated return on the death benefit | Equivalent pre-tax return in the company |
70 | 7.14% | 14.33% |
75 | 6.36% | 12.76% |
80 | 5.88% | 11.80% |
85 | 5.56% | 11.16% |
90 | 5.31% | 10.66% |
95 | 5.10% | 10.23% |
100 | 4.88% | 9.79% |
That is still only half the comparison, because money in a corporate investment account has to come out, and that costs tax again. So run the whole thing side by side. Suppose the company had skipped the policy, put the same $100,000 a year into a portfolio, paid Paul enough in dividends each year from 65 to 84 to leave him the same $75,000 after tax, and passed the rest to his family at 90.
For the family to end up with the same $2,580,235, that portfolio has to earn 11.74% a year, every year, for forty years, with refundable tax credited back along the way. If Paul dies at 85 it has to earn 12.53%. At 95, 10.95%. This is not a battle between insurance and stock market. It’s about a complementary tax strategy that produces a solid return that nobody taxes, and over forty years the absence of tax is worth more than most people expect.
Still, we’re not finished. That comparison above is still conservative, because it counts only the cash the family receives. It ignores the $3,571,416 of capital dividend room left over, and that room is not decoration. Used on surplus the company already holds, it saves $1,704,994 of personal tax that the portfolio version has no way to avoid. Count it, and the alternative has to earn 13.62% a year rather than 11.74% to finish in the same place.
Two honest qualifications. This assumes the alternative earns interest, taxed every year at the full rate. A portfolio of Canadian equities held for decades is taxed later and more lightly, so the bar it has to clear is lower. And every dollar in either version is a dollar not invested in the business, which for many owners is the highest-returning place it could go. Still, fixed income interest is the closest comparison considering the risk or standard deviation of the insurance dividends. They are usually risked-rated somewhere between a GIC and Canadian Government-backed Bond.
Two things are left out that run the other way, and both favour the policy. The first is what happens to Paul's shares. At death he is deemed to have disposed of them at fair market value, and the tax on that gain falls on his final return. In the portfolio version the company is holding a far larger investment account by then, so the shares are worth more and that bill is bigger. Post-mortem planning can reduce it, but it does not disappear, and none of it is in the numbers above. The second is the guarantee fee. Paul pays it to his own company every year, so it is a cost to him and income to the company rather than money leaving the family. It is not modelled on either side.
The part the brochure leaves out
Two numbers have to hold for forty years: the dividend scale and the rate on the loan. Neither is promised to anyone.
Start with the loan. If Paul's rate runs two points higher, at 7.45%, the same $75,000 a year produces this:
| As illustrated (5.45%) | Rate 2 points higher |
Loan at 90 | $3,771,416 | $5,341,379 |
Loan ÷ cash value at 90 | 68% | 96% |
Passes the bank's 90% limit | Never | At 88 |
Cash to the family at 90 | $2,580,235 | $1,010,272 |
At 7.45% the plan is still standing at 88, but only just, and by 95 the loan is larger than the death benefit. Once the loan passes the limit the bank can stop advancing, ask for a payment, or surrender the policy to repay itself. A surrender would leave the company with a taxable gain and no death benefit at all.
Now the dividends. The $5,558,794 of cash value at age 90 is the number at the current scale. The guaranteed cash value at that age, the part the insurer promises whatever happens, is $1,395,385, and the guaranteed death benefit stays at $1,538,462 for life. About three quarters of what the bank is lending against is dividends, and dividends are declared at the insurer's discretion. Nobody expects the scale to fall to the guaranteed floor. The point is that the distance between those two columns is the risk you are taking, and it is worth seeing before you sign rather than at 85.
That is why I would not design one of these at the lender's maximum, and why the policy and the loan need a review every year rather than a filing cabinet.
What else can go wrong
- When the policy belongs to the company and the loan belongs to you, the company's asset is securing your debt. Without a properly priced guarantee fee, the CRA can treat that as a taxable benefit to you.
- The plan assumes the company is still there in forty years. If it is likely to be sold, the policy has to be planned around the sale rather than discovered during it.
- Paul has to qualify medically. The same premium buys less at 60 than at 50, and a rating changes the whole illustration.
Who this is for
The case is strongest when three things are true at once:
- The RRSP and TFSA are already full.
- The company is accumulating cash it does not need to run the business, and will be for years.
- There is a real need for permanent insurance, or a known future liability someone will have to fund, such as the tax on the shares at death.
It also works best when your accountant, the insurance specialist and your wealth advisor model it together. Each can get their own piece right and the plan can still fail where the pieces meet.
Where to go from here
If your company is holding more cash than the business needs and it is sitting in an investment account taxed at just over 50%, it is worth seeing what that money looks like on Paul's timeline. I would be glad to run an illustration on your own numbers, with your accountant in the room, and to show you the guaranteed columns next to the current ones.
Assumptions behind Paul's example
|
This article is for informational purposes only. Any scenario described is a hypothetical, simplified illustration, is not representative of any actual client or outcome, and does not reflect all costs, fees or tax consequences. This is not legal, tax, accounting, insurance or investment advice. Tax rules are complex and subject to change; please consult qualified legal, tax and accounting professionals about your own circumstances. Mike Morgan is a Portfolio Manager and Wealth Advisor with Morgan Wealth Management of RBC Dominion Securities Inc. RBC Dominion Securities Inc. is a member of the Canadian Investor Protection Fund.