RBC Global Insights: Data center power struggle
Electricity has emerged as a key constraint on AI hyperscalers’ ambitious capital spending plans. Data centers consume a growing share of U.S. electricity. Despite rising investment in generation and transmission, capacity is struggling to keep up, and electricity prices are rising.
Electricity has emerged as a key constraint on AI hyperscalers’ ambitious capital spending plans. Data centers consume a growing share of U.S. electricity. Despite rising investment in generation and transmission, capacity is struggling to keep up, and electricity prices are rising.

Josh Nye
Senior Economist, RBC Global Asset Management Inc.
April 15, 2026
Key points
- Data centers accounted for 4.4 percent of U.S. electricity demand in 2023; that share could rise to between 6.7 percent and 12 percent by 2028.
- Adding power plants to the grid takes more than twice as long as building data centers, and while there are plenty of new power projects in the pipeline, history suggests relatively few will reach commercial operation.
- Rising demand from data centers is only one factor driving U.S. electricity prices higher, but local backlash is nonetheless growing and becoming a political issue.
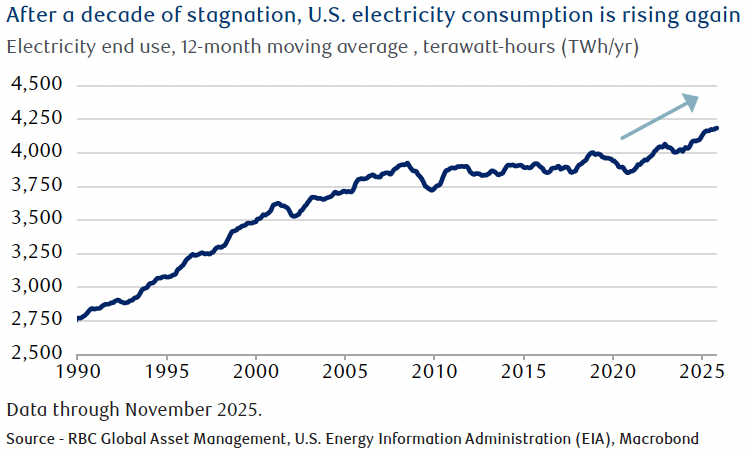
U.S. electricity demand is on the rise
U.S. electricity consumption is rising anew after more than a decade of stagnation. The biggest contributor to the increase is the proliferation of energy-hungry data centers, driven by growing demand for cloud computing, and AI model training and inference (using trained models to make predictions on new data).
Utilities and hyperscalers (companies investing heavily in AI computing power) are scrambling to add capacity, but supply is struggling to keep up with demand. Rising consumer electricity prices have become a political issue, and local resistance to data center projects is growing.
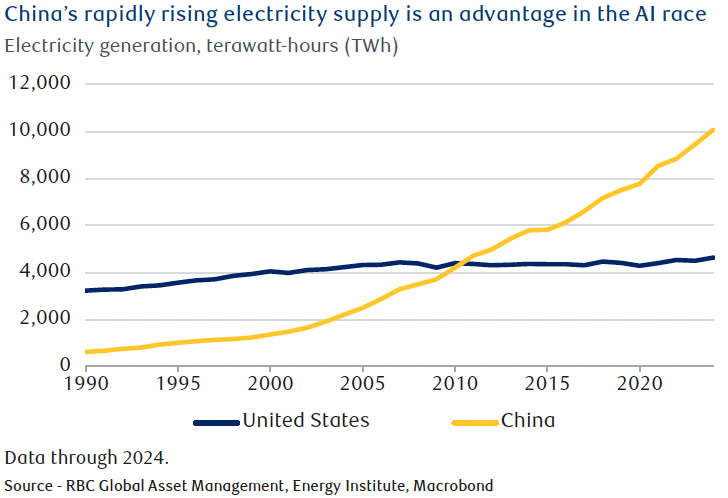
Power might be the single biggest constraint to tech companies’ ambitious capital expenditure (capex) plans: the International Energy Agency (IEA) thinks one-fifth of global data center investment is at risk of delay due to grid bottlenecks. China doesn’t face this challenge—it has invested heavily in new capacity and now generates more than twice as much electricity as the U.S.
The White House faces a tough balancing act to improve electricity affordability without hindering domestic investment and shrinking the country’s sizeable lead in the data center buildout.
Data centers key to rising power consumption
The U.S. Department of Energy (DOE) estimates data center power consumption grew by 18 percent annually between 2018 and 2023, while overall electricity demand was flat. The share of electricity used by data centers more than doubled to 4.4 percent from 1.9 percent over that period, and the DOE estimates this could rise to between 6.7 percent and 12 percent by 2028 depending on factors such as installed computing capacity, energy efficiency, utilization rates, and cooling requirements. While cutting-edge semiconductors are becoming 38 percent more energy efficient every year, installed capacity is growing by 2.3 times annually according to nonprofit research firm Epoch AI, driving overall consumption higher.
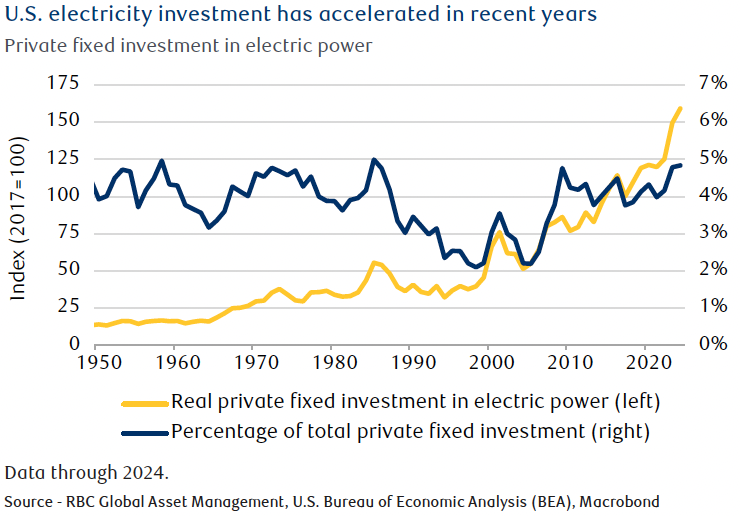
In response to growing demand, electricity investment has accelerated, rising at an inflation-adjusted rate of six percent annually over the past five years. It accounted for nearly five percent of private capex in 2024, the highest share since 1985 (see next chart).
That investment helped utility-scale generation capacity grow at the fastest pace in more than a decade; however, much of the increase came from solar and wind projects. The additional capacity is less impressive when adjusting for intermittency and reliability. Reduced federal funding for green energy projects could slow the pace of new investment.
Adding capacity remains a challenge
The Lawrence Berkeley National Laboratory estimates that more than 10,000 power projects were seeking grid interconnection in the U.S. as of the end of 2024. That represented 1,400 gigawatts (GW) of new generation (about 35 times the net capacity added in 2024) and 890 GW of storage.
History, however, suggests just a fraction of those projects will ultimately become operational. Only 13 percent of interconnection requests between 2000–2019 reached commercial operations by the end of 2024, while 77 percent were withdrawn and 10 percent are still active. Billions of dollars in clean energy projects were canceled last year amid federal funding cuts, according to national nonpartisan business association E2.
Making matters worse, the time it takes to add new power plants to the grid has lengthened considerably. It has risen from less than two years in the early 2000s to more than four years recently (see next chart). Adding new transmission infrastructure can take a decade.
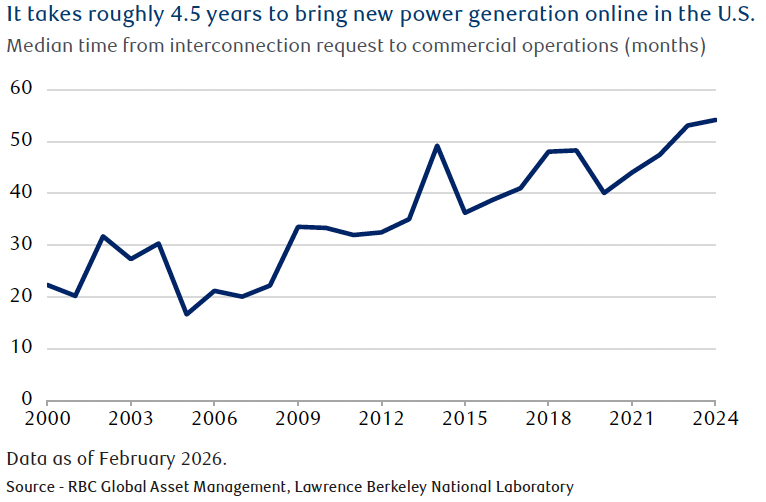
Meanwhile, electricity demand can rise much more quickly: data centers can be built in about two years. The Federal Energy Regulatory Commission (FERC) made rule changes in 2023 to address the backlog of interconnection requests and streamline the process for adding new resources to the grid, but in our opinion, it’s too early to judge their effectiveness. Further rule changes were proposed in 2025.
To get around these delays, more data centers are being built with their own local power generation. Natural-gas-fired turbines are particularly popular, but equipment prices have doubled in recent years, and delivery times now stretch out to several years. Nuclear is making a comeback, with Microsoft and Constellation Energy planning to restart a reactor at Three Mile Island. Google and NextEra Energy are looking to reopen a plant in Iowa—but there is only so much latent capacity. Other patchwork solutions include fuel cells and conversion of Bitcoin mining sites.
Rising electricity prices add to affordability headwinds
Most new data centers still get their power from the grid, and the cost of upgrading electricity infrastructure is generally spread across ratepayers, including households and small businesses. While some utilities charge higher rates for data centers, pricing doesn’t fully cover the cost of new infrastructure. And when utilities purchase electricity on the open market, data center-driven demand pushes prices higher for all customers.
That has contributed to a one-third increase in residential electricity prices over the past five years—more than 1.5 times faster than the overall Consumer Price Index (CPI). To be fair, the sharpest increase in prices occurred before data center construction really began to accelerate (see next chart). Russia’s invasion of Ukraine, which caused a spike in natural gas prices, was a key source of energy inflation in 2022.
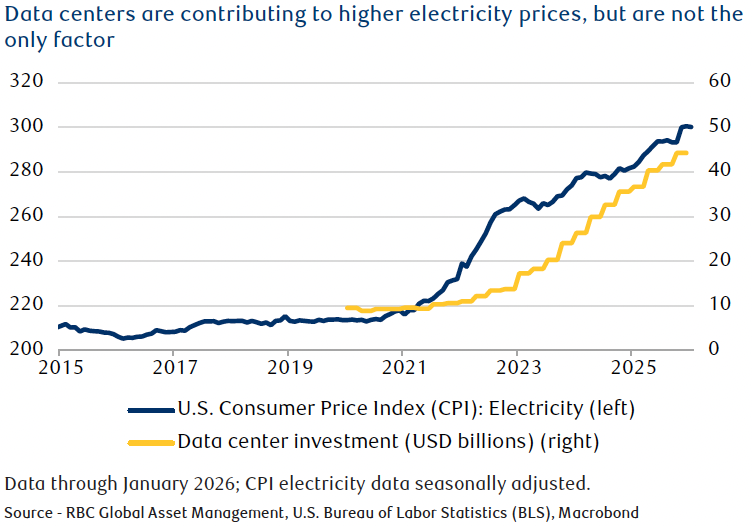
The data center effect is notable. Bloomberg reports wholesale electricity prices increased by as much as 267 percent over five years in areas located near significant data center activity. A Carnegie Mellon study estimates data centers and cryptocurrency mining could lead to an eight percent increase in average electricity generation costs by 2030. The increase could exceed 25 percent in markets with a high concentration of data centers, such as Virginia.
Rising electricity prices are becoming a political issue. They likely contributed to Democratic victories in some state elections last fall, in our opinion. As part of a growing focus on affordability, the White House has called on tech companies to “pay their own way” and is reportedly working on an agreement that would see data center developers fully cover the cost of new energy infrastructure. Some hyperscalers are already pledging to do so, although an opaque rate-setting process makes that difficult to verify.
More broadly, implementing such an agreement will require coordination between grid operators, utilities, state regulators, tech companies, and other data center developers.
For households, electricity represented just 2.5 percent of the CPI basket, so it only contributed 15 basis points to the latest year-over-year inflation figure. But it is a highly visible, recurring, and necessary expense.
Thus, electricity prices might make a greater contribution to perceived affordability challenges, which have sapped consumer confidence. Just as electricity prices were an issue in last year’s state elections, they could play a role in this year’s midterms, particularly in states that have seen substantial price hikes.
Higher electricity prices aren’t just putting politicians’ jobs at risk. Industry research firm Data Center Watch reports that 20 projects representing nearly $100 billion in potential investment were blocked or delayed by local opposition in the second quarter of 2025 alone.
China’s power surge
The U.S.’s power challenges contrast with China, where electricity generation has grown by nearly nine percent annually over the past 25 years (see next chart). Since 2021 alone, China has added more generation capacity than the U.S. has in its history. A major investment push, a streamlined approval process, and an “all of the above” approach embracing both renewables and fossil fuel generation have helped the country add capacity at an unprecedented pace.
BloombergNEF predicts China will continue to extend its lead over the next five years, adding almost six times as much new capacity as the U.S. While data center investment by Chinese tech companies hasn’t kept pace with U.S. hyperscalers and access to leading-edge chips is a challenge, we believe China’s significantly greater power capacity could be a key advantage in the race for AI supremacy.
Power constraints could crimp spending plans
Back in the U.S., the latest round of quarterly earnings saw yet another upward revision to AI capex estimates. Consensus for 2026 spending by the big five hyperscalers—Amazon.com, Alphabet (Google), Meta Platforms (Facebook), Microsoft, and Oracle—now exceeds $675 billion, a more than 60 percent increase relative to last year. But if tech companies are unable to follow through on that investment due to power constraints—and thus unable to monetize growing cloud service backlogs in a timely manner—we believe valuations could be at risk.
This issue is well known and should be reflected to some extent in current share prices and earnings expectations, but there could be room for disappointment and re-pricing if markets are too optimistic about the potential for new capacity to resolve power bottlenecks.
Furthermore, with the computing power required to train the most advanced frontier models growing by a factor of five annually according to Epoch AI, capacity constraints could act as a headwind to model development and the pace of improvement in AI capabilities more generally. Less capacity for inference would also mean slower diffusion of productivity-boosting AI tools to other sectors of the economy.
Research resources
This document is produced by the Global Portfolio Advisory Committee within RBC Wealth Management’s Portfolio Advisory Group. The RBC Wealth Management Portfolio Advisory Group provides support related to asset allocation and portfolio construction for the firm’s investment advisors / financial advisors who are engaged in assembling portfolios incorporating individual marketable securities.
The Global Portfolio Advisory Committee leverages the broad market outlook as developed by the RBC Investment Strategy Committee (RISC), providing additional tactical and thematic support utilizing research from the RISC, RBC Capital Markets, and third-party resources.
The RISC consists of senior investment professionals drawn from individual, client-focused business units within RBC, including the Portfolio Advisory Group. The RISC builds a broad global investment outlook and develops specific guidelines that can be used to manage portfolios.
Global Portfolio Advisory Committee members
Jim Allworth – Co-chairInvestment Strategist, RBC Dominion Securities Inc. Kelly Bogdanova – Co-chairPortfolio Analyst, RBC Wealth Management Portfolio Advisory Group U.S., RBC Capital Markets, LLC Frédérique Carrier – Co-chairManaging Director & Head of Investment Strategy, RBC Europe Limited Luis Castillo – Vice President & Head, Fixed Income Strategies, RBC Wealth Management Portfolio Advisory Group, RBC Dominion Securities Inc. Rufaro Chiriseri, CFA – Director & Head of Fixed Income, British Isles, RBC Europe Limited Janet Engels – Vice President & Head, Global Investments, RBC Wealth Management, RBC Capital Markets, LLC Thomas Garretson, CFA – Fixed Income Senior Portfolio Strategist, RBC Wealth Management Portfolio Advisory Group, RBC Capital Markets, LLC | Patrick McAllister, CFA – Manager, Equity Advisory & Portfolio Management, RBC Wealth Management Portfolio Advisory Group, RBC Dominion Securities Inc. Sean Naughton, CFA – Head, RBC Wealth Management Portfolio Advisory Group U.S., RBC Capital Markets, LLC Alan Robinson – Senior Portfolio Advisor, RBC Wealth Management Portfolio Advisory Group – U.S. Equities, RBC Capital Markets, LLC Michael Schuette, CFA – Multi-Asset Portfolio Strategist, RBC Wealth Management Portfolio Advisory Group U.S., RBC Capital Markets, LLC David Storm, CFA, CAIA – Chief Investment Officer, British Isles & Asia, RBC Europe Limited Yuh Harn Tan – Head of Discretionary Portfolio Management & UHNW Solutions, Royal Bank of Canada, Singapore Branch Joseph Wu, CFA – Portfolio Manager, Multi-Asset Strategy, RBC Dominion Securities Inc. |
Additional Global Insight contributors
Josh Nye – Senior Economist, RBC Global Asset Management Inc.
Required disclosures
Analyst Certification
All of the views expressed in this report accurately reflect the personal views of the responsible analyst(s) about any and all of the subject securities or issuers. No part of the compensation of the responsible analyst(s) named herein is, or will be, directly or indirectly, related to the specific recommendations or views expressed by the responsible analyst(s) in this report.
Important Disclosures
In the U.S., RBC Wealth Management operates as a division of RBC Capital Markets, LLC. In Canada, RBC Wealth Management includes, without limitation, RBC Dominion Securities Inc., which is a foreign affiliate of RBC Capital Markets. This report has been prepared by RBC Capital Markets which is an indirect wholly-owned subsidiary of the Royal Bank of Canada and, as such, is a related issuer of Royal Bank of Canada.
Non-U.S. Analyst Disclosure
One or more research analysts involved in the preparation of this report (i) may not be registered/qualified as research analysts with the NYSE and/or FINRA and (ii) may not be associated persons of the RBC Wealth Management and therefore may not be subject to FINRA Rule 2241 restrictions on communications with a subject company, public appearances and trading securities held by a research analyst account.
In the event that this is a compendium report (covers six or more companies), RBC Wealth Management may choose to provide important disclosure information by reference. To access current disclosures, clients should refer to https://www.rbccm.com/GLDisclosure/PublicWeb/DisclosureLookup.aspx?EntityID=2 to view disclosures regarding RBC Wealth Management and its affiliated firms. Such information is also available upon request to RBC Wealth Management Publishing, 250 Nicollet Mall, Suite 1800, Minneapolis, MN 55401-1931.
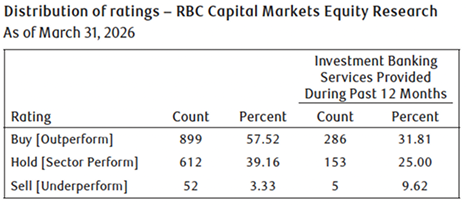
RBC Capital Markets Distribution of Ratings
For the purpose of ratings distributions, regulatory rules require member firms to assign ratings to one of three rating categories – Buy, Hold/Neutral, or Sell – regardless of a firm’s own rating categories. Although RBC Capital Markets’ ratings of Outperform (O), Sector Perform (SP), and Underperform (U) most closely correspond to Buy, Hold/Neutral and Sell, respectively, the meanings are not the same because RBC Capital Markets’ ratings are determined on a relative basis.
Explanation of RBC Capital Markets Equity Rating System
An analyst’s “sector” is the universe of companies for which the analyst provides research coverage. Accordingly, the rating assigned to a particular stock represents solely the analyst’s view of how that stock will perform over the next 12 months relative to the analyst’s sector average.
Outperform (O): Expected to materially outperform sector average over 12 months. Sector Perform (SP): Returns expected to be in line with sector average over 12 months. Underperform (U): Returns expected to be materially below sector average over 12 months. Restricted (R): RBC policy precludes certain types of communications, including an investment recommendation, when RBC is acting as an advisor in certain merger or other strategic transactions and in certain other circumstances. Not Rated (NR): The rating, price targets and estimates have been removed due to applicable legal, regulatory or policy constraints which may include when RBC Capital Markets is acting in an advisory capacity involving the company.
Risk Rating: The Speculative risk rating reflects a security’s lower level of financial or operating predictability, illiquid share trading volumes, high balance sheet leverage, or limited operating history that result in a higher expectation of financial and/or stock price volatility.
Valuation and Risks to Rating and Price Target
When RBC Capital Markets assigns a value to a company in a research report, FINRA Rules and NYSE Rules (as incorporated into the FINRA Rulebook) require that the basis for the valuation and the impediments to obtaining that valuation be described. Where applicable, this information is included in the text of our research in the sections entitled “Valuation” and “Risks to Rating and Price Target”, respectively.
The analyst(s) responsible for preparing this research report have received (or will receive) compensation that is based upon various factors, including total revenues of RBC Capital Markets, and its affiliates, a portion of which are or have been generated by investment banking activities of RBC Capital Markets and its affiliates.
Other Disclosures
Prepared with the assistance of our national research sources. RBC Wealth Management prepared this report and takes sole responsibility for its content and distribution. The content may have been based, at least in part, on material provided by our third-party correspondent research services. Our third-party correspondent has given RBC Wealth Management general permission to use its research reports as source materials, but has not reviewed or approved this report, nor has it been informed of its publication. Our third-party correspondent may from time to time have long or short positions in, effect transactions in, and make markets in securities referred to herein. Our third-party correspondent may from time to time perform investment banking or other services for, or solicit investment banking or other business from, any company mentioned in this report.
RBC Wealth Management endeavors to make all reasonable efforts to provide research simultaneously to all eligible clients, having regard to local time zones in overseas jurisdictions. In certain investment advisory accounts, RBC Wealth Management or a designated third party will act as overlay manager for our clients and will initiate transactions in the securities referenced herein for those accounts upon receipt of this report. These transactions may occur before or after your receipt of this report and may have a short-term impact on the market price of the securities in which transactions occur. RBC Wealth Management research is posted to our proprietary Web sites to ensure eligible clients receive coverage initiations and changes in rating, targets, and opinions in a timely manner. Additional distribution may be done by sales personnel via e-mail, fax, or regular mail. Clients may also receive our research via third-party vendors. Please contact your RBC Wealth Management Financial Advisor for more information regarding RBC Wealth Management research.
Conflicts Disclosure: RBC Wealth Management is registered with the Securities and Exchange Commission as a broker/dealer and an investment adviser, offering both brokerage and investment advisory services. RBC Wealth Management’s Policy for Managing Conflicts of Interest in Relation to Investment Research is available from us on our website at https://www.rbccm.com/GLDisclosure/PublicWeb/DisclosureLookup.aspx?EntityID=2. Conflicts of interests related to our investment advisory business can be found in Part 2A Appendix 1 of the Firm’s Form ADV or the RBC Advisory Programs Disclosure Document. Copies of any of these documents are available upon request through your Financial Advisor. We reserve the right to amend or supplement this policy, Part 2A Appendix 1 of the Form ADV, or the RBC Advisory Programs Disclosure Document at any time.
The authors are employed by one of the following entities: RBC Wealth Management USA, a division of RBC Capital Markets, LLC, a securities broker-dealer with principal offices located in Minnesota and New York, USA; RBC Dominion Securities Inc., a securities broker-dealer with principal offices located in Toronto, Canada; Royal Bank of Canada, Hong Kong Branch, which is regulated by the Hong Kong Monetary Authority and the Securities and Futures Commission (“SFC”); Royal Bank of Canada, Singapore Branch, a licensed wholesale bank with its principal office located in Singapore; and RBC Europe Limited, a licensed bank with principal offices located in London, United Kingdom.
Third-party Disclaimers
The Global Industry Classification Standard (“GICS”) was developed by and is the exclusive property and a service mark of MSCI Inc. (“MSCI”) and Standard & Poor’s Financial Services LLC (“S&P”) and is licensed for use by RBC. Neither MSCI, S&P, nor any other party involved in making or compiling the GICS or any GICS classifications makes any express or implied warranties or representations with respect to such standard or classification (or the results to be obtained by the use thereof), and all such parties hereby expressly disclaim all warranties of originality, accuracy, completeness, merchantability and fitness for a particular purpose with respect to any of such standard or classification. Without limiting any of the foregoing, in no event shall MSCI, S&P, any of their affiliates or any third party involved in making or compiling the GICS or any GICS classifications have any liability for any direct, indirect, special, punitive, consequential or any other damages (including lost profits) even if notified of the possibility of such damages.
Disclaimer
The information contained in this report has been compiled by RBC Wealth Management, a division of RBC Capital Markets, LLC, from sources believed to be reliable, but no representation or warranty, express or implied, is made by Royal Bank of Canada, RBC Wealth Management, its affiliates or any other person as to its accuracy, completeness or correctness. All opinions and estimates contained in this report constitute RBC Wealth Management’s judgment as of the date of this report, are subject to change without notice and are provided in good faith but without legal responsibility. Past performance is not a guide to future performance, future returns are not guaranteed, and a loss of original capital may occur. Every province in Canada, state in the U.S., and most countries throughout the world have their own laws regulating the types of securities and other investment products which may be offered to their residents, as well as the process for doing so. As a result, the securities discussed in this report may not be eligible for sale in some jurisdictions. This report is not, and under no circumstances should be construed as, a solicitation to act as securities broker or dealer in any jurisdiction by any person or company that is not legally permitted to carry on the business of a securities broker or dealer in that jurisdiction. Nothing in this report constitutes legal, accounting or tax advice or individually tailored investment advice. This material is prepared for general circulation to clients, including clients who are affiliates of Royal Bank of Canada, and does not have regard to the particular circumstances or needs of any specific person who may read it. The investments or services contained in this report may not be suitable for you and it is recommended that you consult an independent investment advisor if you are in doubt about the suitability of such investments or services. To the full extent permitted by law neither Royal Bank of Canada nor any of its affiliates, nor any other person, accepts any liability whatsoever for any direct, indirect or consequential loss arising from, or in connection with, any use of this report or the information contained herein. No matter contained in this document may be reproduced or copied by any means without the prior written consent of Royal Bank of Canada in each instance. In the U.S., RBC Wealth Management operates as a division of RBC Capital Markets, LLC. In Canada, RBC Wealth Management includes, without limitation, RBC Dominion Securities Inc., which is a foreign affiliate of RBC Capital Markets, LLC. This report has been prepared by RBC Capital Markets, LLC. Additional information is available upon request.
To U.S. Residents: This publication has been approved by RBC Capital Markets, LLC, Member NYSE/FINRA/SIPC, which is a U.S. registered broker-dealer and which accepts responsibility for this report and its dissemination in the United States. RBC Capital Markets, LLC, is an indirect wholly-owned subsidiary of the Royal Bank of Canada and, as such, is a related issuer of Royal Bank of Canada. Any U.S. recipient of this report that is not a registered broker-dealer or a bank acting in a broker or dealer capacity and that wishes further information regarding, or to effect any transaction in, any of the securities discussed in this report, should contact and place orders with RBC Capital Markets, LLC. International investing involves risks not typically associated with U.S. investing, including currency fluctuation, foreign taxation, political instability and different accounting standards.
To Canadian Residents: This publication has been approved by RBC Dominion Securities Inc. RBC Dominion Securities Inc.* and Royal Bank of Canada are separate corporate entities which are affiliated. * Member Canadian Investor Protection Fund. ® Registered trademark of Royal Bank of Canada. Used under license. RBC Wealth Management is a registered trademark of Royal Bank of Canada. Used under license.
RBC Wealth Management (British Isles): This publication is distributed by RBC Europe Limited and Royal Bank of Canada (Channel Islands) Limited. RBC Europe Limited is authorised by the Prudential Regulation Authority and regulated by the Financial Conduct Authority and the Prudential Regulation Authority (FCA registration number: 124543). Registered office: 100 Bishopsgate, London, EC2N 4AA, UK. Royal Bank of Canada (Channel Islands) Limited is regulated by the Jersey Financial Services Commission in the conduct of investment business in Jersey. Registered office: Gaspé House, 66-72 Esplanade, St Helier, Jersey JE2 3QT, Channel Islands.
To persons receiving this from Royal Bank of Canada, Hong Kong Branch: This document is distributed in Hong Kong by Royal Bank of Canada, Hong Kong Branch which is regulated by the Hong Kong Monetary Authority and the SFC. This document is not for distribution in Hong Kong, to investors who are not “professional investors”, as defined in the Securities and Futures Ordinance (Cap. 571 of Hong Kong) and any rules made under that Ordinance. This document has been prepared for general circulation and does not take into account the objectives, financial situation, or needs of any recipient. Past performance is not indicative of future performance. WARNING: The contents of this document have not been reviewed by any regulatory authority in Hong Kong. Investors are advised to exercise caution in relation to the investment. If you are in doubt about any of the contents of this document, you should obtain independent professional advice.
To persons receiving this from Royal Bank of Canada, Singapore Branch: This publication is distributed in Singapore by the Royal Bank of Canada, Singapore Branch, a registered entity licensed by the Monetary Authority of Singapore. This publication is not for distribution in Singapore, to investors who are not “accredited investors” and “institutional investors”, as defined in the Securities and Futures Act 2001 of Singapore. This publication has been prepared for general circulation and does not take into account the objectives, financial situation, or needs of any recipient. You are advised to seek independent advice from a financial adviser before purchasing any product. If you do not obtain independent advice, you should consider whether the product is suitable for you. Past performance is not indicative of future performance. If you have any questions related to this publication, please contact the Royal Bank of Canada, Singapore Branch.
© 2026 RBC Capital Markets, LLC – Member NYSE/FINRA/SIPC © 2026 RBC Dominion Securities Inc. – Member Canadian Investor Protection Fund © 2026 RBC Europe Limited © 2026 Royal Bank of Canada All rights reserved RBC1524