
Paul Chapman
Senior Portfolio Manager & Wealth Advisor
May 29, 2026
“At 10 times revenues, to give you a 10-year payback, I have to pay you 100% of revenues for 10 straight years in dividends. That assumes I can get that by my shareholders. That assumes I have zero cost of goods sold, which is very hard for a computer company. That assumes zero expenses, which is really hard with 39,000 employees. That assumes I pay no taxes, which is very hard. And that assumes you pay no taxes on your dividends, which is kind of illegal. And that assumes with zero R&D for the next 10 years, I can maintain the current revenue run rate. Now, having done that, would any of you like to buy my stock at $64? Do you realize how ridiculous those basic assumptions are? You don’t need any transparency. You don’t need any footnotes. What were you thinking?” - Scott McNealy, co-founder and then-CEO of Sun Microsystems. He said it in a March 2002 interview (often cited from Bloomberg/Business Week) looking back on the dot-com bubble, when Sun's stock had peaked at around $64 per share with a ~10x price-to-sales valuation
Note that the contents of this memo are all my thoughts, and not the views of RBC Dominion Securities. As well, no part of this content was AI-assisted or created.
[YOU CAN LISTEN TO THE ABBREIVATED PODCAST VERSION OF THIS NOTE HERE]
Friends & Partners,
Just when you thought things could not get more confusing, you enter the environment we’re in today – this Partner Memo is here to make some sense of things, and tackle the often confusing and humbling subject of the economy and markets.
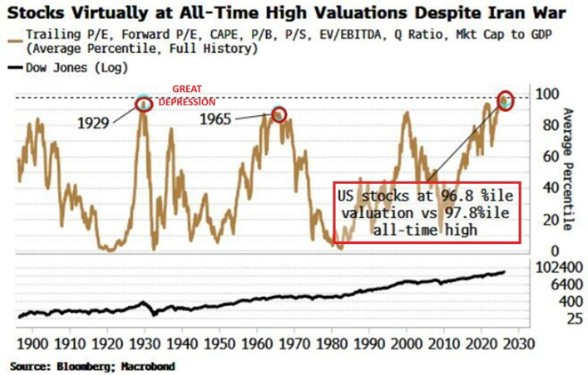
It’s not often that I see some of the most experienced and respected market pundits and strategists scratching their heads, but we are in one of those times. The list of things to worry about has been long, and many have questioned why they aren’t influencing the market more negatively: the ongoing Iran conflict, broader geopolitics, terrible consumer confidence, sky-high valuations, increasing bond yields, surging inflation, a highly concentrated market… just to name a few.
On the other hand, over time, the stock market prices in one ultimate item – company earnings. And company earnings are blowing the doors off. This is largely lead by the current AI and energy boom, but it’s enough to create the optimism that is keeping markets strong.
But on the other side of things is the bond market – and it’s not so impressed. Global bond yields have been pushing higher across the curve (meaning both near term bonds like 2 year duration, and longer term bonds like 10 or 20 year duration). Surging energy prices and inflation expectations have been risking – this is not good. Beyond inflation concerns, fiscal deficits don’t help things here. In the UK for example, the 30 year government bond is seeing its highest yield since 1998. Japan has a similar dynamic.
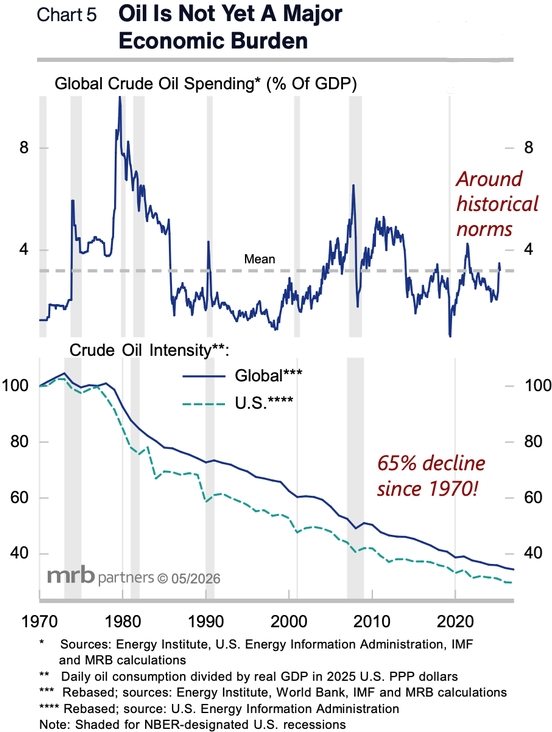
Why aren’t high oil prices slowing down the economy? It is because advanced economies like ours are far less hydrocarbon-dependent than 20 years ago. Since 2006, nominal income in the US has doubled even as oil prices have remained around the same level. Over that period, real GDP is 50% larger but the economy consumes roughly the same amount of oil. When you add in the dramatic reversal in the net energy trade balance, meaning that the US is now a big exporter of oil, the increase in oil prices since the start of the conflict has likely added to US GDP!
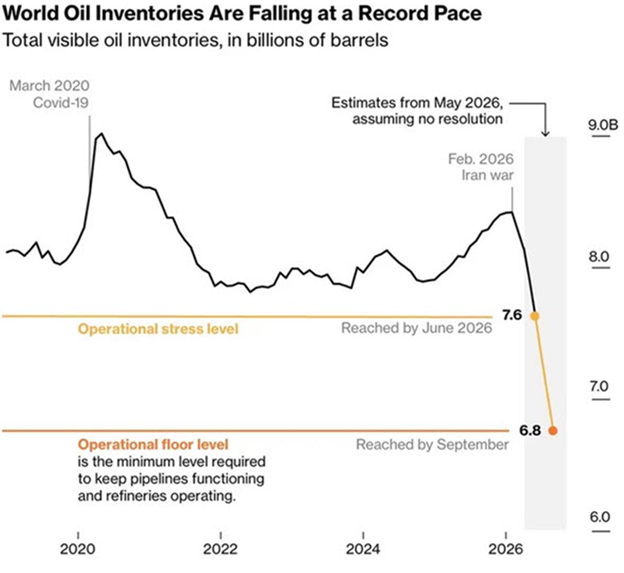
However, markets are assuming that the Iran conflict ends soon, and things go back to ‘normal’ quickly. Perhaps. Many also wonder why oil prices aren’t higher given everything going on? In part because the United States has responded by cranking up oil exports, while China has slashed imports. We are seeing almost 15 million barrels per day output forfeiture, equal to about 15% of global supply. Even with this historic level support from the US and China, JPMorgan notes that inventories in the Organisation for Economic Co-operation and Development could reach ‘operational stress levels’ early June. Some firms like Cornerstone see almost $200/bbl Brent prices…
The risk that prolonged oil prices stay high is an underappreciated risk by the markets, and it’s because most don’t understand the engineering and how challenging it is to turn the oil flow ‘back on’. This is what we call the “Kitchen Faucet” fallacy, the assumption that oil production operates like a simple on/off valve or switch. That is simply not the case, particularly across Gulf and Middle Eastern legacy operations that are largely state-owned. Unlike the pressure-driven gushers depicted in popular TV series (i.e., Landman), most production in that region relies on complex, “continuous flow” systems supported by constant water and steam injection. Throttling output is manageable, but a full halt creates severe structural and engineering complications that are costly, time consuming, and often permanently detrimental to future flow rate recovery. This is precisely why a U.S.-Iran peace deal is so critically time sensitive, and thus the reopening of the Strait of Hormuz. If tankers cannot begin moving cargo from export storage to create capacity for oil still flowing from active operations, the risk of a prolonged production disruption, regardless of Hormuz's ultimate status, rises exponentially each day.
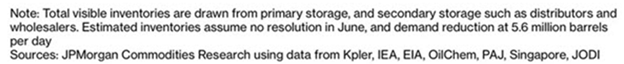
Oil prices directly and indirectly account for roughly 15% of CPI (consumer inflation). If oil prices settle even slightly higher than pre-war levels after the Strait eventually reopens, that will affect price levels materially. Oil price shocks have had significant negative effects on the economy and markets throughout history:
Now add to this that the Central Bank has expanded their balance sheet dramatically in recent years, and is going to cut that back down. With a new Fed Chair (Warsh), he has his work cut out for him! He now has the issue of not only solving the oil shock and inflation implications, but we have to unwind the Fed balance sheet as well.
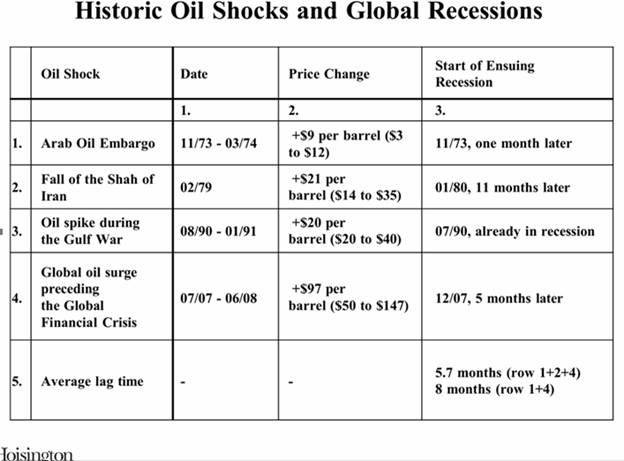
Earnings are the core of the market, and have been impressive. But they are coming from a narrow cohort, and it’s important to know that some of the most rapid earnings growth outside of recoveries occurred toward the ends of major bull markets such as in July 1929, December 1973, March 2000 and early 2007. As well, the actual free cash flow being generated by these companies is not as shiny. The price to free cash flow ratio of the S&P 500 is now at the highest point of the last decade. The risk that these crazy levels of capital expenditures don’t produce the expected return-on-investment is a potentially underappreciated risk , and as we saw during the DotCom bubble, it’s difficult to know when free-cash-flow matters to the market, but it likely will at some point…
Finally, we have to discuss the ‘gambling mentality’ of so many investors nowadays, which contributes to the market action as well. Stocks are one investing vehicle for many in the younger generations today. A house purchase is out of the question for many, so that slow and steady savings vehicle has vanished. A significant share of the investing wallet is directed towards prediction markets, crypto, meme coins, and the outcome of this week’s sports events. It should go without saying that the deck is stacked against you in many of these outlets, and are all fueled by speculation. . Retail traders may own a modest share of total financial assets, but they account for almost 20% of stock turnover and the bulk of the growth in options trading. As Keynes warned: “When the capital development of a country becomes a by-product of a casino, the job is likely to be ill-done.” As this seems less metaphor than literal descriptor for stock markets today, expect more long-term, patient capital to find its way to private markets.
So, structural headwinds are piling up: persistent inflation, expanding global deficits, risking debt levels, all while geopolitics is getting evermore messy and countries retrench (‘deglobalization’). This all points to higher volatility and ‘term premiums’ in bonds, which just means higher bond yields. This all equates to tougher times in both equities and bonds, and a high likelihood that bonds fail to diversify your equity risk – this is something I have been screaming from the rooftops for the past few years, and so far has proven correct. Based on historical data, periods when inflation sits meaningfully above central bank targets have been associated with weak bond-diversifying power. Meaning, traditional portfolio mixes will fail to cushion the downside when markets inevitably weaken, and especially if/when inflation stays higher than normal. Most investors have built portfolios around the assumption that the post-2008 world would continue indefinitely. I don’t believe that to be the case today.
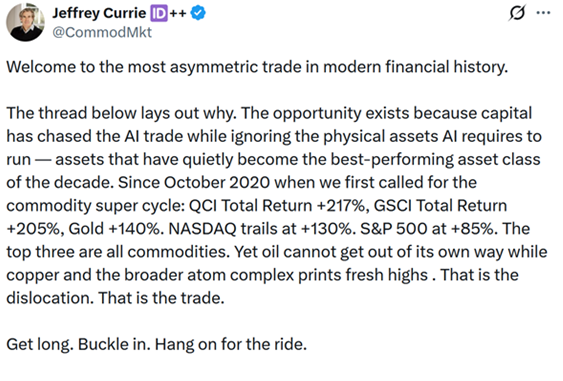
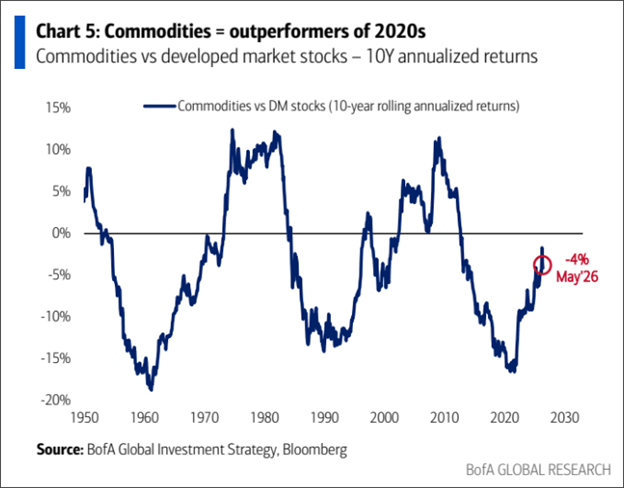
There are opportunities, as there always are. Just in different places than in the past. , investors hope that AI will lead to widespread improvements in productivity and earnings growth. This is starting to happen, at least in part. If so, then the strong stock market should broaden and continue. Another opportunity is in the commodity space I believe, making Canada generally attractive overall. We are likely in the early stages of a commodity supercycle again, and unlike China’s urbanisation-driven boom in the 2000s, demand is likely more broad and ultimately resilient in this cycle because there is global diversification across AI, electrification and defence.
Other Interesting Things To Highlight
I am so proud to be supporting My Friend’s House again this year, and they had their first big event of the year, the East Coast Kitchen Party which sold out in 3 days! Amazing to see the support of the community. My Friend’s House is a non-profit agency offering support for abused women and children living in the Georgian Triangle. Since opening in 1991, My Friend’s House has helped thousands of women get the safety and support they need to rebuild their lives, and serves 600 women and their children each year. This is an important one to support.

I am honoured and humbled to have been a part of a recent RBCDS conference in Europe. It was a wonderful trip, and underscores the focus that RBC Dominion Securities has on the business and the culture, illustrating again why it is a leading wealth management platform. Spending time with the leaders in our business is invaluable. My being there is simply a result of discipline, the support from one of the best teams in the business, and a sole focus on doing the right thing for our clients.

We hosted the one and only Brian Belski for a client event on May 27th at Craigleith Ski Club. Getting Brian to Collingwood in Canada took some coordination given his busy schedule, and we were excited to be able to host him. It proved to be a very insightful and fun evening. Brian is a former colleague of mine and is one of the leading investment strategists on the planet. He is also one of the very few managers that has consistently beat the market over both the short and long term. He is a very frequent contributor to CNBC, Bloomberg, Fox Business News, and BNN, where his market calls are closely followed by investors globally. Brian served as the Chief Investment Strategist at BMO Capital Markets for many years, where he guided portfolio strategy for some of the world’s largest institutional investors and private wealth clients. In his more than 35-year investment career, Brian has held senior strategy and research positions at BMO, Oppenheimer & Company, Merrill Lynch, and Piper Jaffray, where his consistency in messaging, coupled with process-driven conclusions, helped shape stock market and investment views for decades. Brian has recently founded an independent investment firm Humilis Investment Strategies, and we work closely with him on our equity holdings across our portfolios.

Finally, you’re invited to an exclusive virtual event featuring Frances Donald, Senior Vice President and Chief Economist, RBC. This event is taking place Tuesday, June 16, at 11:00 a.m. ET. She is very good, and entertaining. In conversation with Jim Allworth, Investment Strategist, RBC Dominion Securities, Frances will provide a timely overview of the current economic landscape and the implications for investors. The discussion will help break down:
· Canada’s resilient growth amid global uncertainty
· Geopolitical risks reshaping markets
· The widening gap in consumer spending patterns
· Tariffs, commodities, and sector opportunities
Register HERE
A Dose of Caution Is In Order
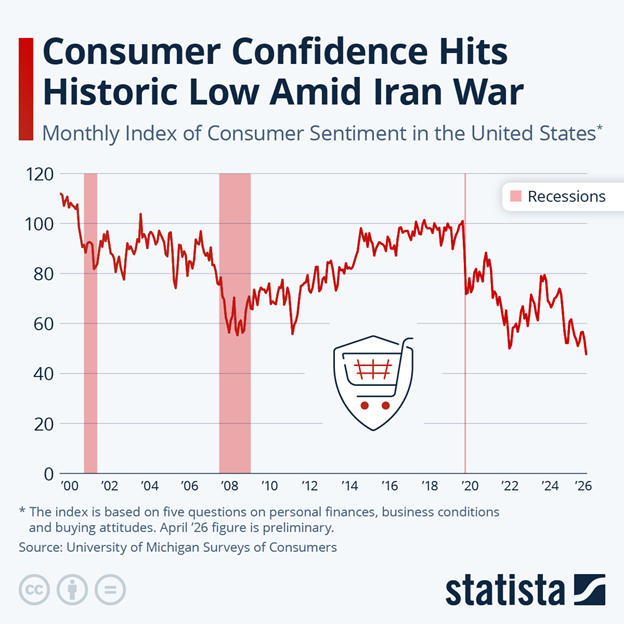
It goes without saying that broader ramifications of the geopolitical chaos are not being respected enough in markets today. Some supply chains remain battered, and uncertainty around global commerce has surged, while companies focus more at home than abroad. Tariffs, sanctions, export controls, and geopolitical blocs are reducing efficiency in global trade and investment. As a result, consumer confidence has hit record lows:
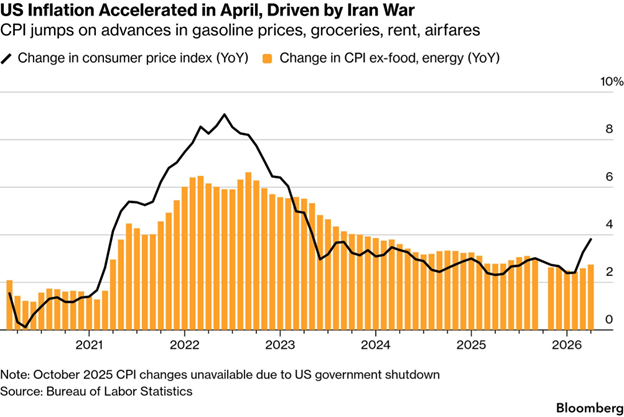
As a result, the U.S consumer price index recently hit 3.8%, representing an accelerated pace of inflation that has remained consistently above its 2% target for five years straight.
This has all driven bond prices lower, and therefore yields sharply higher of late. This is an issue on multiple fronts for markets and the economy. Thirty-year U.S. Treasury yields just hit their highest level since 2007.
And we have to mention valuations – obviously, large pockets of the current market aren’t exactly on sale.
But earnings keep rocking! However, let’s dig in here…
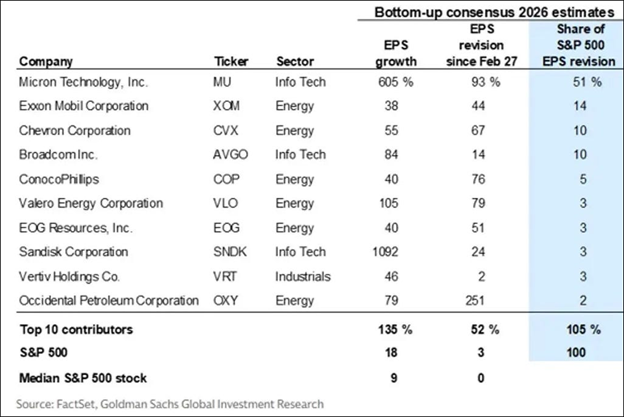
Here is Goldman Sachs with a dose of cold water for the earnings bulls, who have been pushing this market higher of late. As of last week, 105% of the increase in the S&P 500 EPS revision was the result of 10 stocks. Micron Technology was responsible for half of it alone, and six of the ten were energy stocks, with the rest being AI CAPEX plays.
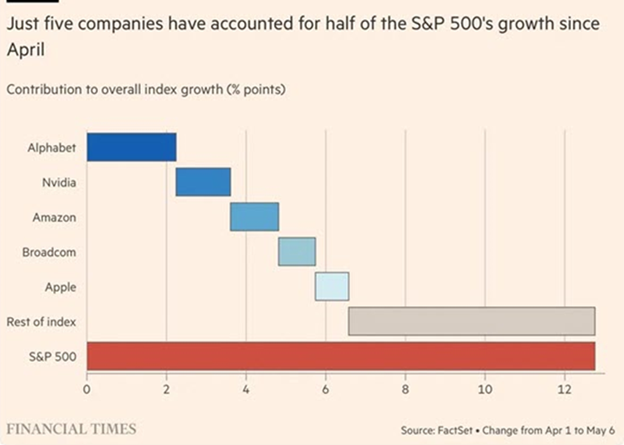
As well, the breadth of the rally is concerning to some. “Wall Street’s rebound since late March has been driven by the smallest number of stocks on record, pushing US market concentration to an all-time high and prompting warnings about the ‘fragility’ of the rally,” reports The Financial Times.
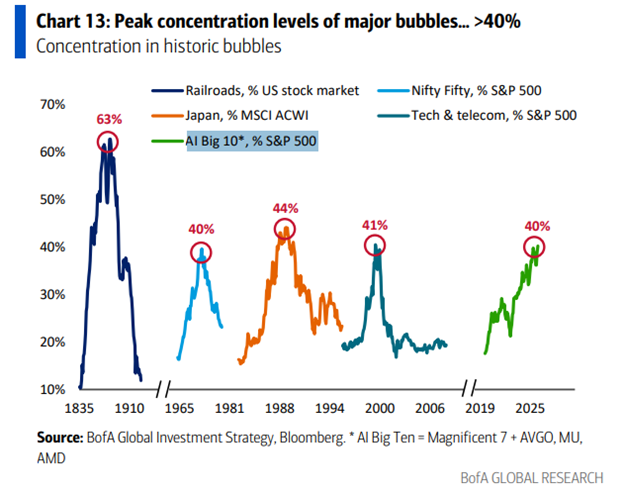
How sustainable is the current AI investment boom? That is the million dollar question. The boom-bust nature of historical precedents should give investors pause:
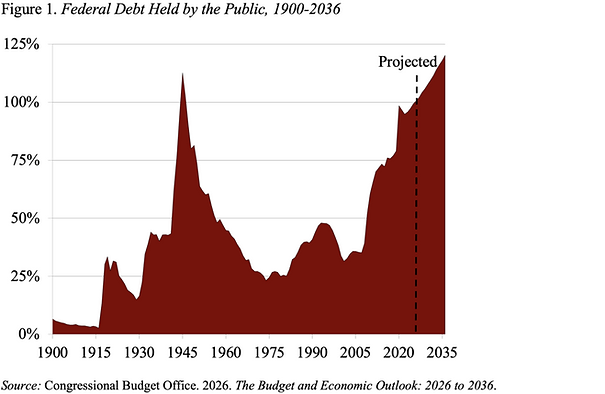
And back to bonds having significant headwinds here on multiple fronts – one of which is that the sheer amount of debt embedded in the system is projected to surpass that of the WW2 era shortly.
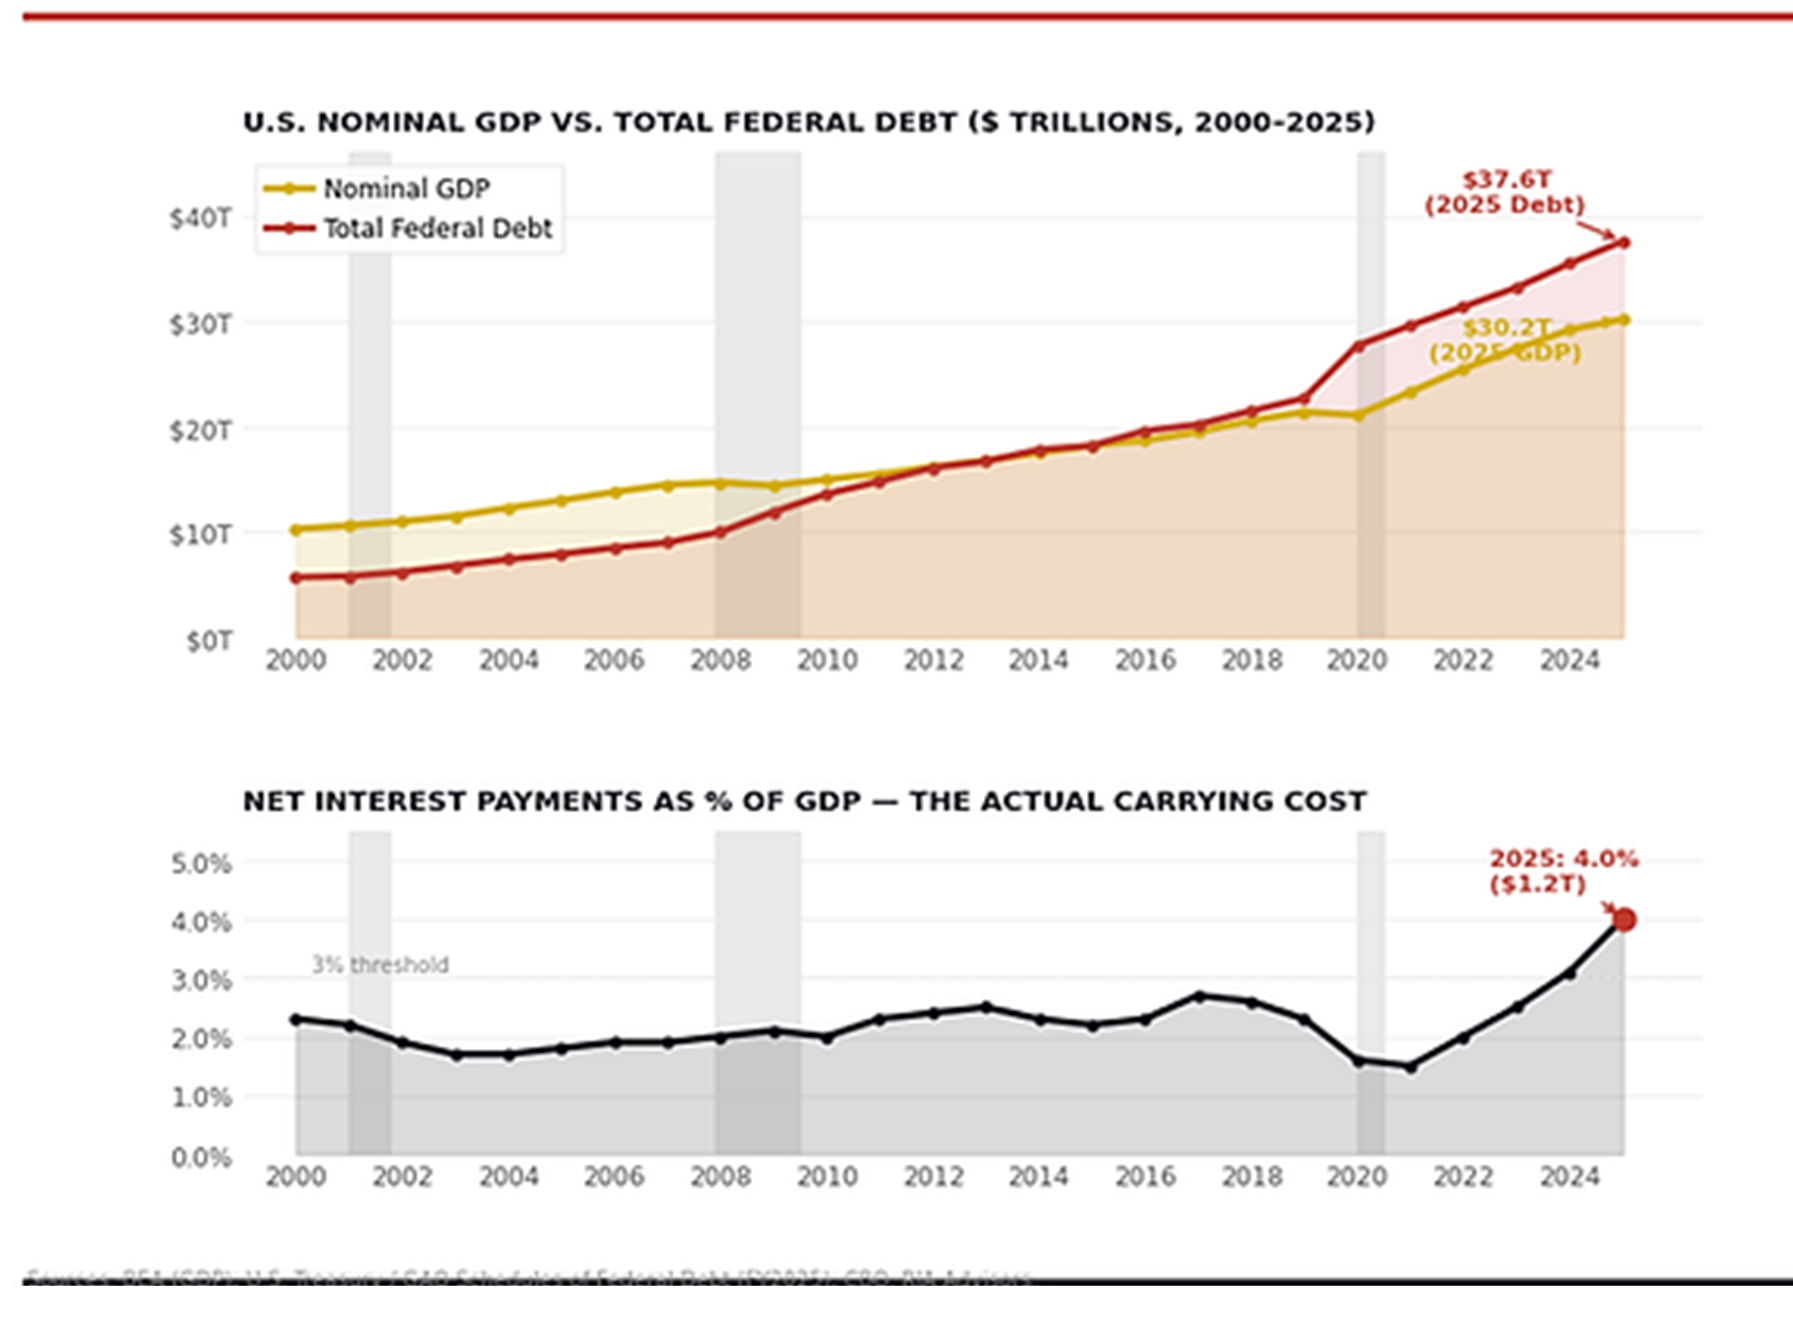
And the debt service costs are rising rapidly, accounting for an ever-increasing percentage of the economy.
The US government (and therefore markets) may have a short term debt problem. The bars on the graph below show the percentage of the debt set to mature over the next 12 months. It varies because Treasury has the discretion to issue short-term debt (T-bills), long-term T-bonds or other maturities in between. Recently the mix tilted heavily toward short-term debt.
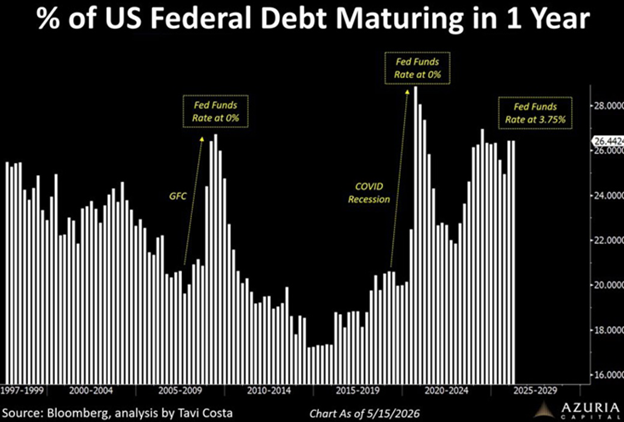
This can be beneficial in keeping interest expense low, but it also creates “rollover risk” as each maturing T-bill may have to be refinanced at a higher rate. Interest costs can escalate quickly in a rising-rate environment. Note also that the chart shows the percentage of the debt. The debt level is much higher now, meaning the dollar figures are much larger than ever. The risks are larger, too.
Torsten Slok of Apollo is one of the leading economic thinkers, and argues that the US government finances are not equipped for a recession. That is because during US recessions, the budget deficit typically widens by ~4% of GDP as unemployment benefits surge and tax revenues collapse. That would be manageable if the US were entering a potential recession from a position of fiscal strength, but it is not. In fact, the US has never entered a recession with this little fiscal buffer. The standard recession playbook that growth slows, the Fed cuts, rates fall and multiples expand breaks down when the sovereign borrower is already stretched.
He notes that in the front end, inflation driven by higher energy prices, tariffs and immigration restrictions is proving stickier than the Fed expected, constraining how aggressively it can cut. At the long end, the fiscal trajectory is structurally bearish for bonds. And in a recession, the deficit blows out further, requiring even more issuance at precisely the moment when market appetite for duration is most uncertain. The bottom line is that rates are staying higher for longer across the curve.
There Are Always Reasons For Optimism
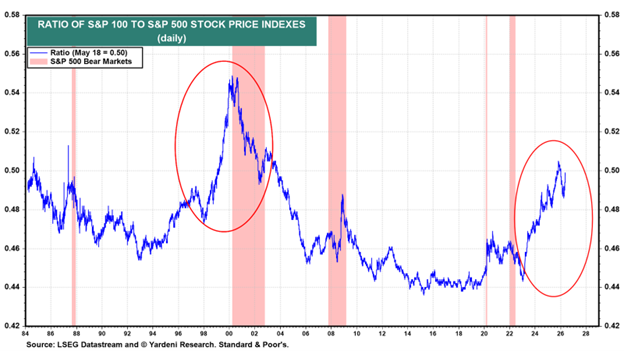
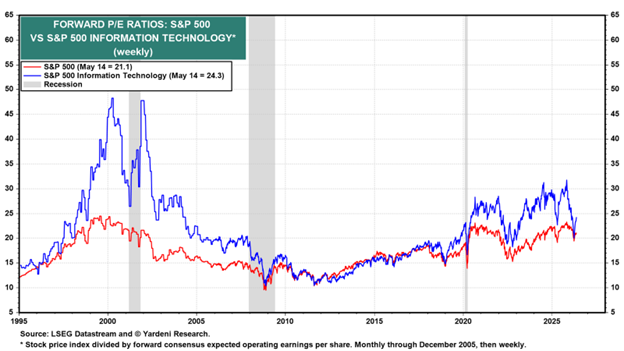
Many are pointing to the current market and AI influence as similar to the tech bubble. Perhaps. But the comparison of the two arguably shows fewer excesses in the current bull market so far. For example, the ratio of the S&P 100 to the S&P 500 remains well below its late-1990s peak :
Most importantly, the current forward P/E for the S&P 500 Information Technology sector is 24.3x, not much above the S&P 500's 21.1x. During the Tech Bubble of the late 1990s, the spread between the two was around 20 points:
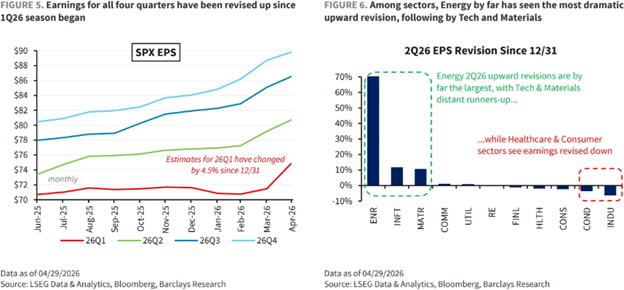
Consistently strong earnings delivery remains a tailwind for equities at this point:
As discussed in the opening section, oil prices are not yet a burden on the economy.
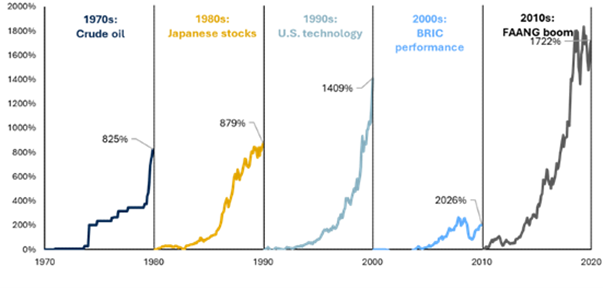
It may not be only US growth/tech stocks that drive stocks moving forward – last year’s resurgence in international markets is a subtle reminder for newer investors that shifts in leadership occur quite frequently. For example, if you look at the dominant investment themes over the past few decades, you can see that U.S. equities have not always been the leader:
Source: RBC GAM; Bloomberg, FRED
As well, value stocks have been making a comeback finally, and should continue to. Like they did a quarter century ago, during the bursting of the DotCom Bubble, value stocks could make a strong comeback again. GMO reports that deep value stocks are trading extraordinarily cheaply relative to broad markets and their own history, and believe that U.S. deep value is priced to outperform the rest of the market by more than 50%.
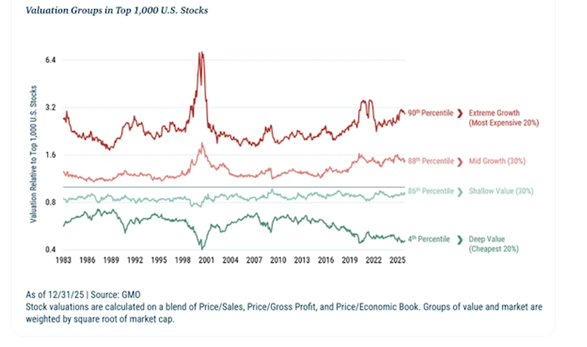
The extreme positioning and valuation gap are stark reminders that portfolios should be well diversified to avoid concentration risk, and to capture the next equity market leader, wherever that may be. History consistently demonstrates that market leadership rotates across sectors, geographies and asset classes.
In terms of strategies and sectors to continue to consider (as we have), think about a few:
Commodities continue to perform:
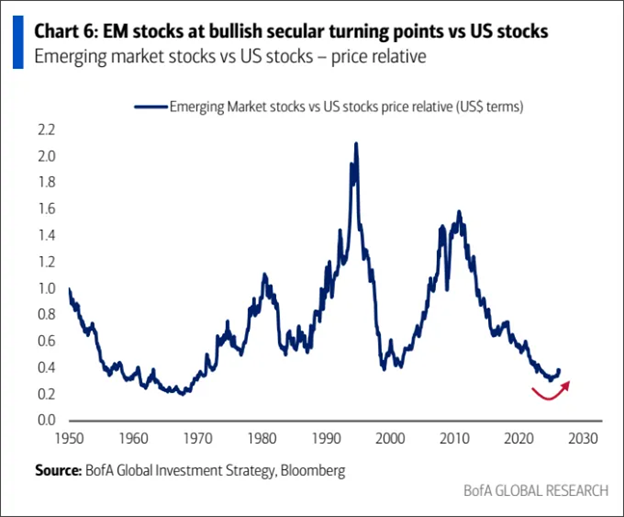
Emerging markets have turned:
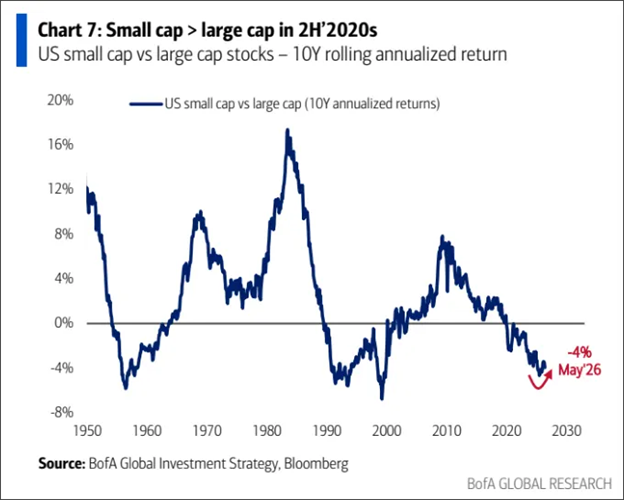
Small caps have as well:
A Note On Real Estate & Framing The Investment
This is not an ‘I told you so’ moment, rather an educational piece to put things into perspective. For generations, Canadians have viewed real estate as the safest and most reliable path to wealth. Stocks make headlines when they drop. Housing feels steady.
I have had MANY conversations over the past 6 years with clients and others about the perils of real estate. This closely equates to the perils of leverage, which works both ways so dramatically.
If you purchase a $1mm property and put down $200k, you have $800k of leverage. If the price goes up $200k and you sell it – you have doubled your money (made $200k gain on your $200k equity investment); so easy! BUT, if the property value drops to $800k, you just evaporated 100% of your investment. Ouch. Unfortunately, there are a number of folks in this predicament today.
In many cases, equities have matched or exceeded returns from Canadian real estate, particularly when the power of reinvested income and compounding is considered. The long-term numbers may surprise you.
Since 2005, a hypothetical $300,000 investment in the S&P/TSX Composite Total Return Index would have grown to $2.0 million assuming dividends were reinvested. By comparison, the Canadian national average home price grew to roughly $834,600 over the same period.
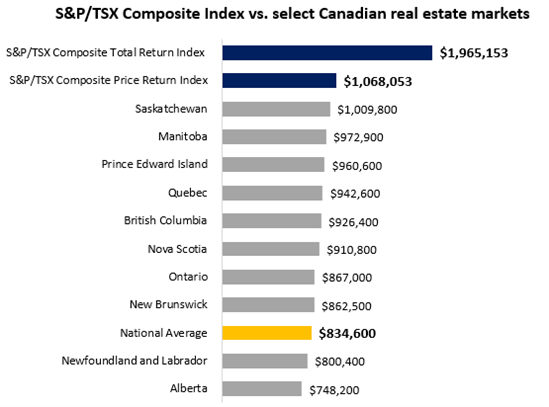
All data as of March 31, 2026. The chart assumes a $300,000 starting investment in 2005. Housing price data compiled by RBC Global Asset Management Inc. from Canadian Real Estate Association (CREA). S&P/TSX Composite Total and Price Return Index data compiled by RBC Global Asset Management Inc. All returns are annualized, and where applicable, compounded assuming reinvestment of all distributions. Please note that data for the Montreal market is not seasonally adjusted. An investment cannot be made directly into an index.
Even the S&P/TSX Price Return Index, which excludes dividends and offers a closer comparison to home price appreciation alone, grew to more than $1 million.
Over time, that gap widened significantly as reinvested dividends continued compounding year after year, a reminder that long-term wealth creation is often driven as much by reinvested income as price appreciation itself.
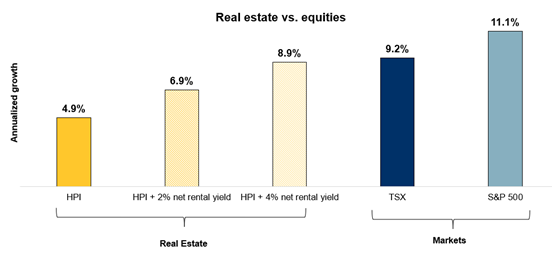
But what about the rental income? Rental income narrows the gap — but not entirely According to the Canadian Home Price Index (HPI), home prices have grown at an average rate of 4.9% a year since 2005. But price appreciation is only half the equation. Rental income can materially improve returns for investors who own income-producing properties.
To account for this, we modeled three real estate scenarios using Canadian housing data since 2005:
· Owner occupied - Home price appreciation only: 4.9% annualized return
· Average rental market - Home price appreciation + 2% net rental yield: 6.9% annualized return
· Hot rental market - Home price appreciation + 4% net rental yield: 8.9% annualized return
For comparison:
· TSX annualized return: 9.2%
· S&P 500 annualized return: 11.1%
Source: Data is from Jan 1, 2005 to March 31, 2026. Housing price data compiled by RBC Global Asset Management Inc. from Canadian Real Estate Association (CREA). S&P/ TSX Composite and S&P 500 Total Return (CAD) Index data compiled by RBC Global Asset Management Inc. Rental yield is defined as annual net income equal to 2% or 4% of the property’s value, following methodology referenced in The Globe and Mail. All returns are annualized, and where applicable, compounded assuming reinvestment of all distributions. An investment cannot be made directly into an index. The graph does not reflect transaction costs, investment management fees, or taxes. If such costs and fees were reflected, returns would be lower. Past performance is not a guarantee of future results.
BOTTOM LINE: Even under the strongest rental income scenario, both the TSX and S&P 500 continued to outperform over the long term. None of this suggests real estate is a poor investment. For many Canadians, home ownership remains an important source of stability, leverage and long-term wealth creation. However, history also shows the risks of relying too heavily on a single asset class.
A note on leverage:
These comparisons assume unleveraged investments. In practice, most Canadians buy real estate with a mortgage, which can significantly improve returns by allowing investors to control a larger asset with less capital up front (though interest costs and maintenance reduce the net gain). Leverage is powerful – in both directions…