
Troy Private Wealth Partners
August 30, 2024
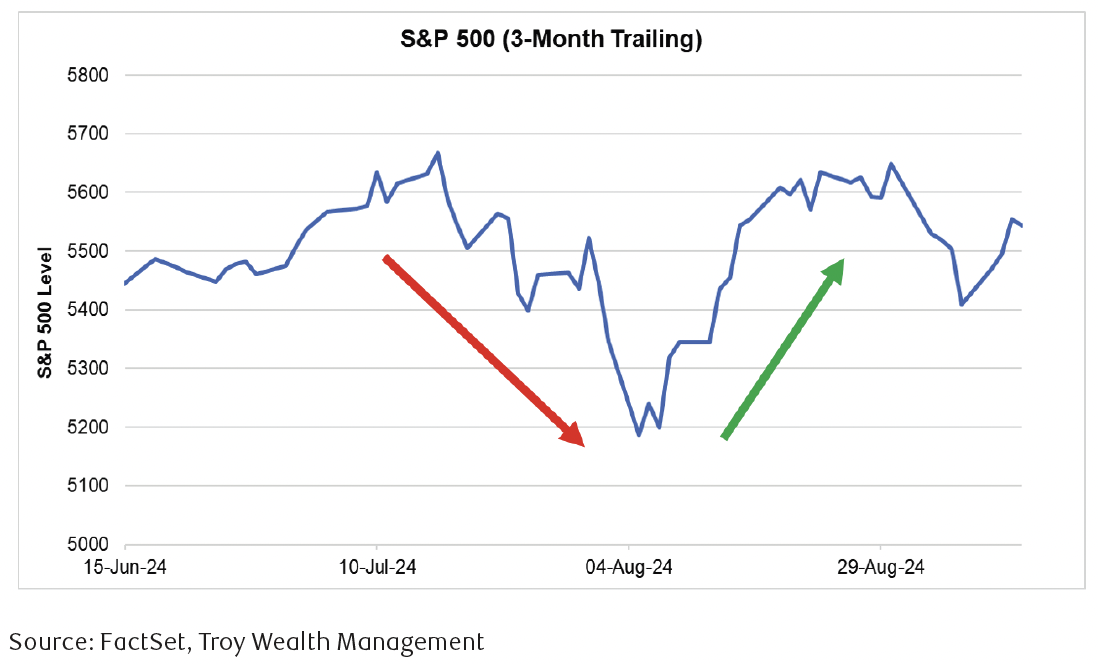
Major equity indices grinded higher in August, but it certainly wasn’t a smooth ride. In the first few trading days of the month, stocks experienced a fair amount pressure. The S&P TSX, S&P 500, and Nasdaq composite sold off -5.3%, -6%, and -8%, respectively. There were a few culprits behind the initial drawdown in equities. On August 2, we had weaker than expected U.S. employment data. The unemployment rate increased to 4.3% (versus 4.1% expected), new jobs created came in at 114,000 (versus 175,000 expected), and year-over-year (YoY) wage growth increased 3.6% (versus 3.7% expected). Just a day later, Warren Buffett revealed he trimmed nearly half of his position in Apple. The stock remains his largest position at $88 billion, but investors are now wondering why Mr. Buffett has grown his cash position to roughly $300 billion. Lastly, there was an unwinding of the carry trade against the Japanese Yen. To simplify, investors could borrow Japanese Yen at very low rates of interest and invest in higher-yielding assets elsewhere. However, the recent strength in Japan’s economy led the Bank of Japan to embark on tightening cycle, leading the Yen to strengthen which caused the unwind. Investors began to liquidate their foreign investments to buy back the Yen, leading to an even stronger than anticipated move in the currency. This caused considerable weakness across international markets, especially in Japanese stocks.
Despite a trifecta of weaker than expected economic data, Mr. Buffett’s disclosed cash position, and an unwinding of the Japanese Yen carry trade, stocks quickly reversed course and finished the month higher. The volatility we experienced in the early days of August is a testament to remain invested during times of market turbulence.
Index | August | 3-Month Trailing | YTD Return |
|---|---|---|---|
S&P TSX | 1.2% | 5.6% | 13.7% |
S&P 500 | 2.4% | 7.4% | 19.5% |
Nasdaq | 0.6% | 5.8% | 18.0% |
WTI Oil | -6.1% | -4.4% | 3.7% |
Natural Gas | 4.5% | -17.8% | -15.4% |
10-Year US Treasury Bond | 1.4% | 6.0% | 2.6% |
USD/CAD FX | -2.3% | -1.0% | 1.9% |
Source: FactSet
Chart 1: Stocks reversed course in August after a rapid decline
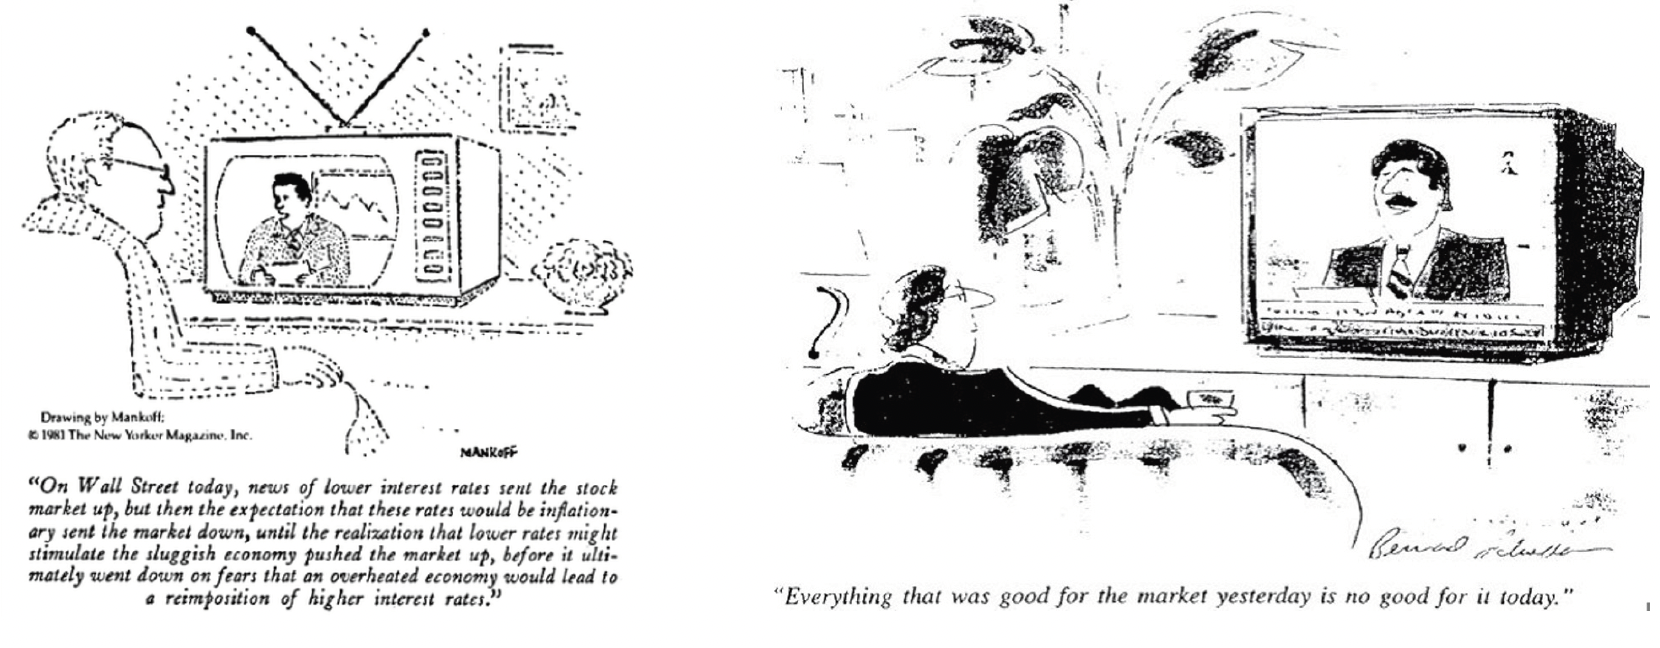
Howard Marks, the founder of Oaktree Capital Management, recently published a piece regarding the furious drawdown of equities at the beginning of August and their subsequent recovery. Oaktree is a fantastic private debt manager and Marks’ memos are widely anticipated among investors globally. There were a few points he made in particular that are worth mentioning in our August commentary. The Intelligent Investor is a book first published in 1949 by Benjamin Graham, who was Warren Buffett’s mentor at Columbia Business School. In this book he introduces “Mr. Market” which he uses as a metaphor for the market as a whole. An example given in the book is to imagine that in some private business you own a share that cost you $1,000. One of your partners, named Mr. Market, is very obliging indeed. Each day he tells you what he thinks your share is worth and furthermore offers either to buy you out or to sell you an additional share on that basis. Sometimes his idea of value appears plausible and justified by business developments and prospects as you know them. Often, on the other hand, Mr. Market lets his enthusiasm or fears run away with him, and the value he proposes seems to you a little short of silly. Mr. Market’s behaviour is inconsistent and the prices he assigns to stocks each day can sometimes wildly diverge from their fair value. Emotional miscalculations like we saw in August can lead to future profit opportunities for investors looking to take advantage of them.
Now you’re probably wondering if reality changes so little day-to-day, why do we see estimates of value change so dramatically and so quickly? Marks believes it mostly has to do with emotion and changes in mood. He cited a memo he wrote 33 years ago and the words written still ring true today: “The mood swings of the securities markets resemble the movement of a pendulum…between euphoria and depression, between celebrating positive developments and obsessing over negatives, and thus between overpriced and underpriced. This oscillation is one of the most dependable features of the investment world, and investor psychology seems to spend much more time at extremes than it does at a happy medium.” As he points out, these mood swings can cause prices to fluctuate drastically just like they did at the beginning of August. In good times, investors seem to obsess about the positives and ignore the negatives, interpreting things favourably. Then when the pendulum swings, they do the opposite, with dramatic effects. Further, recency bias can substantially impact markets when decisions are based solely on recent events, expecting that those events will continue. This often leads to irrational decision making, exacerbating moves in the market.
Marks also highlights in his memo that if stock prices actually traded from rational, dispassionate evaluation of data, presumably one piece of negative information would move the market down a little, and the next such piece would move it down a little bit more, and so forth. But instead we see that an optimistic market is capable of ignoring individual pieces of bad news until a critical mass of bad news builds up, at which time a tipping point is reached, the optimists surrender, and a rout begins. The same is true in reverse. Emotion and investor psychology plays an integral role in market behaviour, which is why it’s so important to remain calm and steady when markets act erratic (they often do).
Chart 2: Whimsical 1980’s cartoons depict Mr. Market’s frequent miscalculations
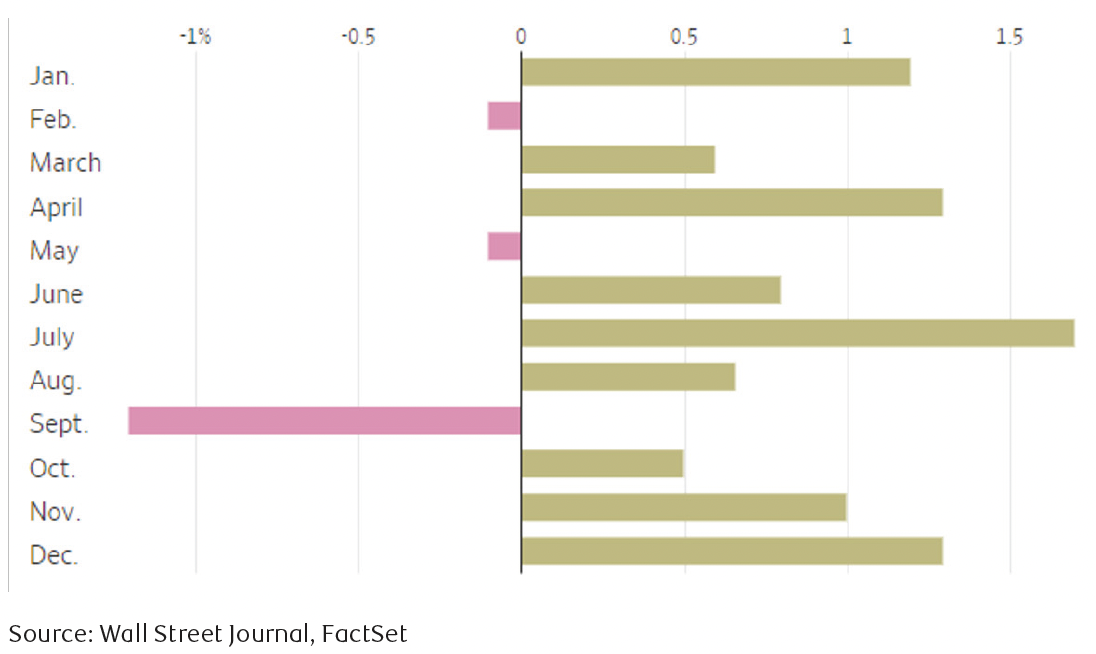
We have now entered the most seasonally challenged period of the year for equities. Since 1928, September has been the worst performing month of the year for equity investors (Chart 3). August through October seems to always be seasonally weak, but why is this the case? There are a few points or theories to consider. Firstly, it’s possible institutional money managers are back from summer holidays and are now deciding to take a more defensive stance on markets as we move into the final few months of the year. This could be the case this year especially given the noise and uncertainty surrounding the U.S. Presidential election. In the previous commentary we mentioned the importance of remaining invested in election years and this year is no different. Further explaining the historical September slide, some investment management firms publish their year-end results and holdings at the end of October. There could be some liquidating or repositioning happening ahead of their reporting requirements. Finally, equities have enjoyed double-digit returns thus far in 2024. There could simply be some profit-taking as we enter the final few months of the year.
Chart 3: Since 1928 S&P 500 average monthly returns
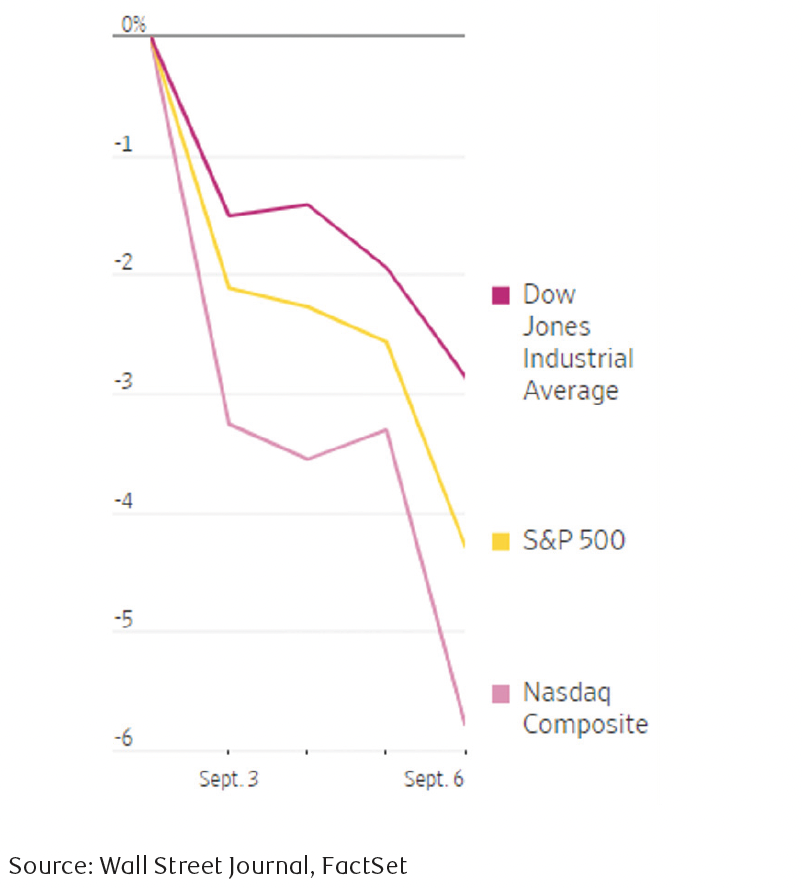
September has lived up to its poor reputation as depicted in Chart 4 with major equity indices all trading lower to begin the month. This decline has since reversed at the time of writing this commentary, but there are still plenty of trading days left to see how the rest September shakes out.
Chart 4: September lives up to its poor reputation
As we move into the fall, it is important to stay focused on the evolving market landscape. While uncertainties persist, opportunities continue to present themselves across key sectors. We remain committed to our disciplined approach, closely monitoring trends and adapting to shifts as needed. As always, we encourage investors to maintain a long-term perspective, and we thank you for your continued trust.