February 2025 Market Commentary
Major equity indices have been volatile to kickstart the year, and February was no different. Stocks were off to the races in January before pairing back more recently. The Canadian S&P TSX (-0.4%) outperformed the American S&P 500 (-1.3%) and Nasdaq composite (-4.0%) for a second straight month.
Major equity indices have been volatile to kickstart the year, and February was no different. Stocks were off to the races in January before pairing back more recently. The Canadian S&P TSX (-0.4%) outperformed the American S&P 500 (-1.3%) and Nasdaq composite (-4.0%) for a second straight month.

Troy Private Wealth Partners
February 27, 2025
Major equity indices have been volatile to kickstart the year, and February was no different. Stocks were off to the races in January before pairing back more recently. The Canadian S&P TSX (-0.4%) outperformed the American S&P 500 (-1.3%) and Nasdaq composite (-4.0%) for a second straight month. Given the incessant negative headlines regarding the Canadian economy and its perceived vulnerability to Tariff Man, who would of thought that the S&P TSX would be outperforming year-to-date? At the time of writing this commentary in March, the S&P TSX is still leading (+1.4%) versus the S&P 500 (-3.5%) and Nasdaq composite (-8.1%).
Index (Total Return) | February | 3-Month Trailing | YTD Return |
|---|---|---|---|
S&P TSX | -0.4% | -0.3% | 3.1% |
S&P 500 | -1.3% | -1.0% | 1.4% |
Nasdaq | -4.0% | -1.9% | -2.4% |
WTI Oil | -3.9% | 2.5% | -3.4% |
Natural Gas | 26.0% | 14.0% | 5.5% |
10-Year U.S. Treasury Bond | 3.0% | 0.7% | 3.7% |
USD/CAD FX | -0.4% | 3.3% | 0.6% |
Source: FactSet
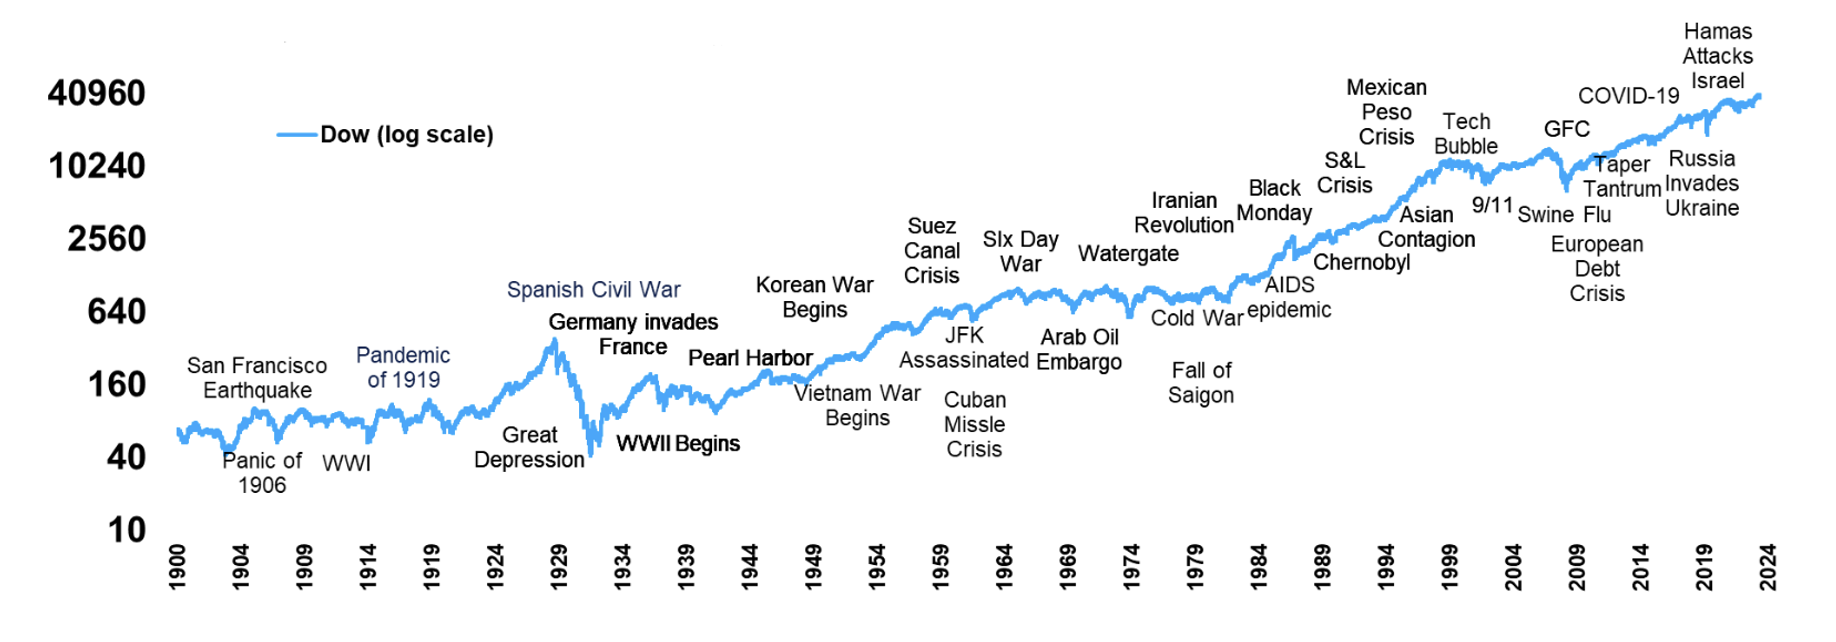
With the swirling headlines and increasingly poor market sentiment, Chart 1 is a gentle reminder to stay the course. If we told you the market was going to endure World War I, the Pandemic of 1919, a Great Depression, World War II, Pearl Harbour, the JFK Assassination, an Oil Embargo, Watergate, a Cold War, Black Monday, the Tech Bubble, 9/11, Swine Flu, the Great Financial Crisis, COVID-19, an Inflation Spike, Russia Invading Ukraine, and Hamas Attacking Israel, would you have guessed the market would be +6,150,254% higher?
Even over the last decade, so much has happened geopolitically. If you had invested $1 million at the start of 2015 in the face of multiple troubled events (Trump 1.0 uncertainty, COVID-19, rampant inflation, and multiple wars to name a few) it would compound to be worth close to $3 million today. Continuing to invest despite all the negative headlines and market downturns is crucial to our collective long-term success. History has shown us that markets tend to show resiliency during times of uncertainty.
Chart 1: Stocks tend to grind higher, even in the face of terrible news
Dow Jones since 1900 with major geopolitical events
Source: Carson Investment Research
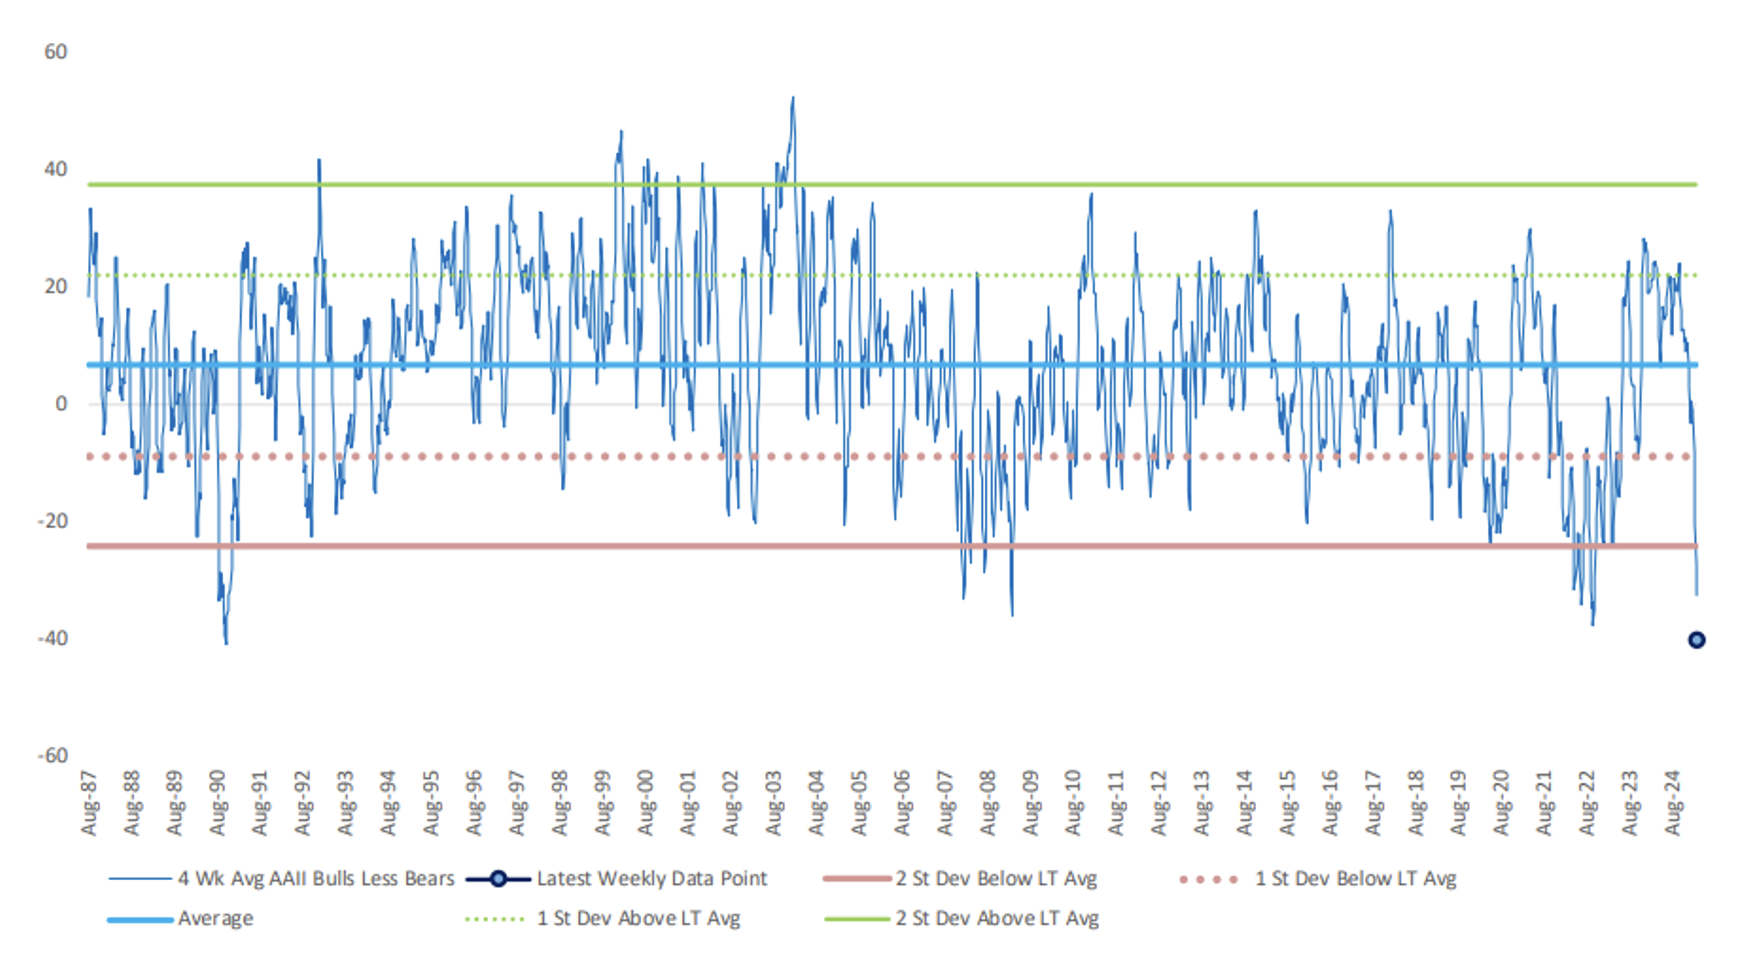
An indicator we keep an eye on is the American Association of Individual Investors Sentiment Survey (AAII). The AAII Sentiment Survey offers insight into the opinions of individual investors by asking its members their thoughts on where the market is heading in the next six months and has been doing so since 1987. Investor sentiment is measured with a weekly survey and gives investors a forward-looking perspective of the market instead of relying on historical data.
The AAII Sentiment Survey is a reliable contrarian indicator. If sentiment is euphoric and individual investor bullishness is high, this would suggest that stocks would have downside risk over the next few months. Chart 2 demonstrates that investor sentiment is currently at extreme lows – over two standard deviations below its long-term average. A -40 score suggests that investors are currently 60% bearish, 20% neutral, and just 20% bullish. The deep level of bearishness seen on this survey is in-line with the Great Financial Crisis, and 2022 lows during the battle against inflation. Investing in stocks during both of those frantic periods led to fantastic returns.
According to RBC Capital Markets, when sentiment is this terrible the equity markets typically perform well going forward. A reading this bearish suggests we could see a rebound of more than +10% on a 9-month forward basis and it also suggests that at least in some corners of the investment community, the pessimism has gotten too extreme.
Chart 2: Investor sentiment is at extreme lows, which is a bullish indicator
AAII Bulls Less Bears
Source: RBC Capital Markets, AAII Sentiment Survey
Believe it or not, we are only in the month of March. It has been quite the year already given the policy shifts and turns undertaken by the U.S. administration. While many people, including ourselves, are “tariff-ed” out at this point, we discuss some of the early impacts from the trade war thus far. At the risk of being obsolete, we will refrain from providing much of an update on where things stand with respect to tariffs. On the one hand, temporary exemptions and delays have emerged recently, which lessens the immediate blow to the economic outlook, and potentially moves us further away from a worst-case scenario. On the other hand, the constant upheaval in policy has made an already uncertain environment even more unpredictable. Not surprisingly, it is beginning to weigh on consumers, businesses, and investors.
As just mentioned, a variety of different surveys released in the U.S. over the past month have suggested a deterioration in consumer sentiment. It has been felt across all demographic and most income groups. Expectations on future business conditions, jobs availability, and income prospects have worsened. Not surprisingly, references to trade and tariffs were evident from those consumers that responded to the survey, as were comments around inflation. On the latter, there has been a notable uptick in short and long-term U.S. inflation expectations as consumers have started to brace for the impact that tariffs may have on the price of every-day goods and services. This is expected to be short-lived however, according to the Federal Reserve’s most recent comments with pricing pressures to subside in 2026 through 2027.
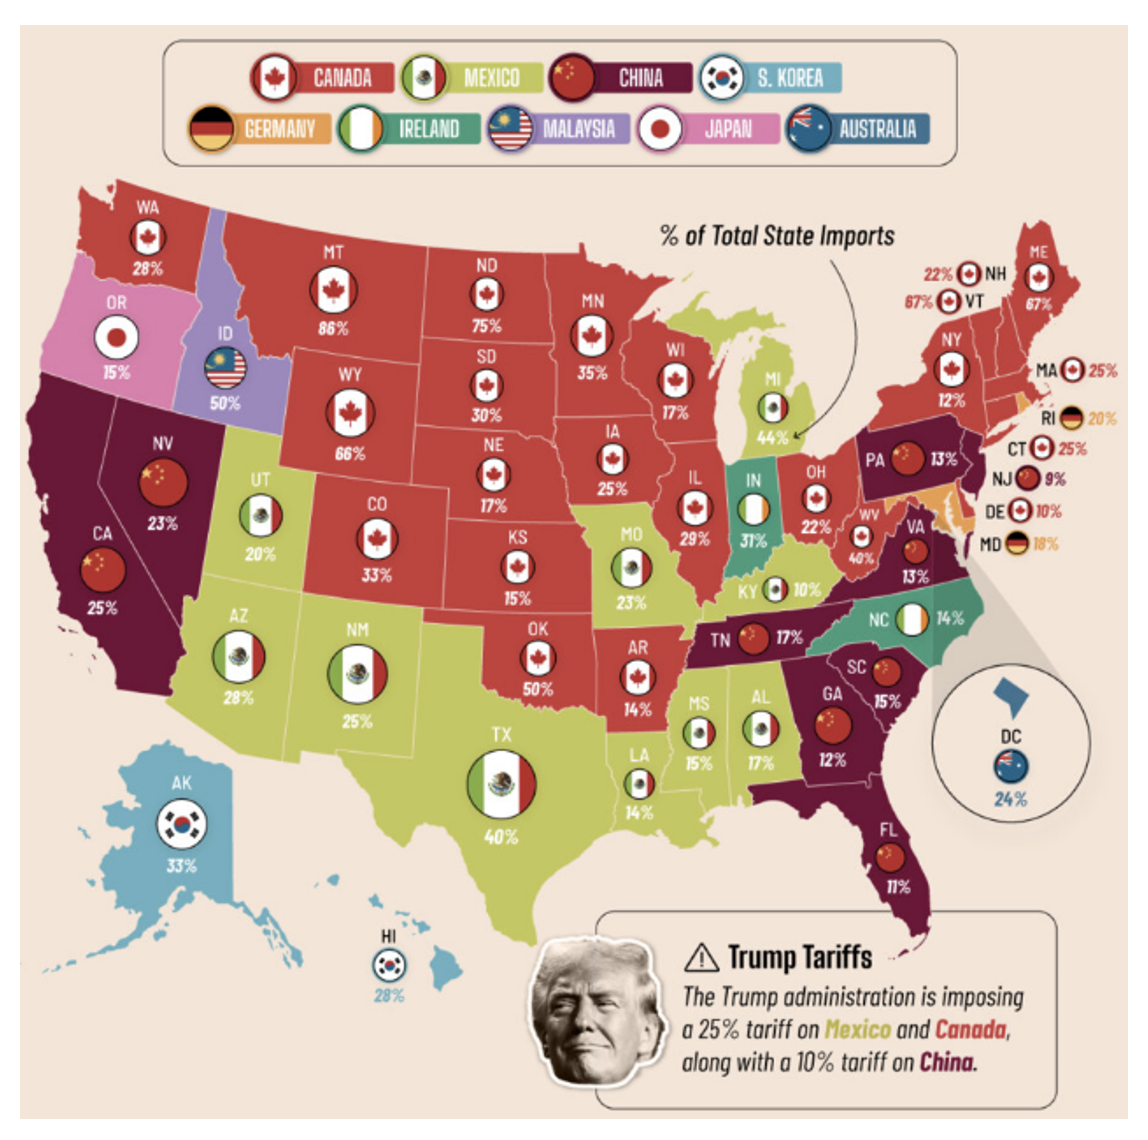
On the business front, recent U.S. economic reports suggest some signs of weakness are starting to emerge. Business activity and new order measures within recent services sector reports are pointing to a slowing in growth through the first quarter of the year. The surveys highlighted that policy uncertainty is weighing on demand growth, both domestically and outside the country. Separately, the U.S. Federal Reserve’s “Beige Book”, which is published eight times during the year, was released recently. It provides a collection of anecdotal feedback taken from a variety of sources across the U.S. Overall, it suggested a slowing of growth across some of its districts. The report highlighted that some manufacturing and construction firms suggested tariffs were already raising material costs and creating uncertainty for long-term pricing and investment decisions. Chart 3 is a great depiction of U.S. reliance on its trading partners and the impact tariffs will have on each state.
Chart 3: The top import partner of every U.S. state – tariffs will be felt by everyday Americans
Source: U.S. Census Bureau
Company Highlight
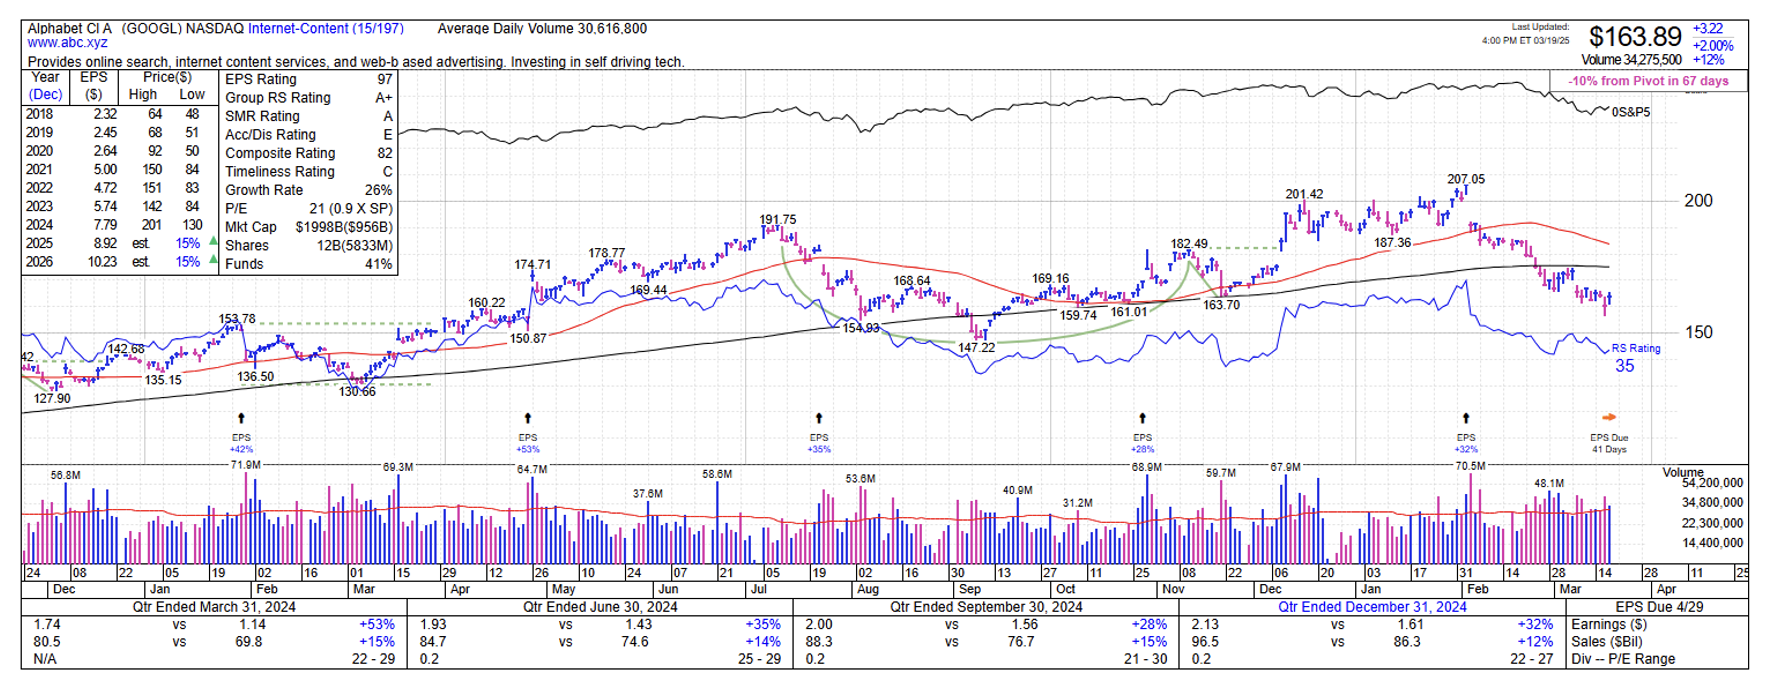
Alphabet is the most trafficked website on earth as a top search destination providing the leading search marketing platform for advertisers and merchants. The company’s three reporting segments are Services, Cloud, and Other Bets. Services include Android, Chrome, Google Workspace products, Google Play (app store), Search and YouTube. The Google Cloud segment refers to infrastructure and platform services, collaboration tools, and other services for enterprise customers. The Other Bets segment relates to the sale of healthcare-related services, internet services, and even their autonomous self- driving “Waymo” division.
Alphabet, otherwise known as Google, is a core holding for our client portfolios. Over the last five years, the business has grown its revenue on a compounded basis of 16.7% per year. The most recent 2024 gross and profit margins were 58% and 25%. This business has nearly zero debt on its balance sheet and has about $150 billion of cash and cash equivalents at its disposal - the growth and financial health of the business is incredibly strong.
On March 18, Google announced a definitive agreement to acquire Wiz, Inc. which is a leading cloud security platform for $32 billion in an all-cash transaction. This is just 21% of the cash and cash equivalents on the balance sheet and will build Google’s capabilities in cyber and could gain itself access to a new/broader set of workload opportunities with the Wiz customer base and vice-versa. As mentioned in our previous commentary, companies around the world have significant demand for cyber-focused tools. Our analysts note that Wiz is known for its industry-leading security tools for developers and that the Google Cloud and Wiz combination will help develop further defenses against threats that come with advancements in AI.
From a forward price-to-earnings basis, shares of Google are currently trading at a 33% discount to its 5-year average. In our view, this presents an attractive opportunity for investors to add for the long-term.
Chart 4: Alphabet (GOOGL, GOOG) is trading at a trough-like multiple