July 2024 Market Commentary
On July 13, former President Trump survived an assassination attempt and the nation rallied around his recovery. Just days later oddsmakers assigned a 65% probability of Trump winning the presidential election followed by the incumbent Biden (15%), Harris (9%), Newsom (3%), and so on.
On July 13, former President Trump survived an assassination attempt and the nation rallied around his recovery. Just days later oddsmakers assigned a 65% probability of Trump winning the presidential election followed by the incumbent Biden (15%), Harris (9%), Newsom (3%), and so on.

Troy Private Wealth Partners
July 30, 2024
Despite recent significant political events, equity markets continued to climb higher in July. The S&P TSX led the charge (+5.9%) followed by the S&P 500 (+1.2%) and Nasdaq Composite (-0.8%). The materials sector performed strongly in July (+9.2%) and is a sizeable contributor to the Canadian S&P TSX. At a market-weight of 13%, the sector is a large component of the Canadian index relative to its U.S. peers. The S&P 500 and Nasdaq Composite have just 2% and 1% of materials exposure, respectively. Gold as a sub-sector of Materials rallied +13.5% in the face of geopolitical uncertainty.
Index | July | 3-Month Trailing | YTD Return |
|---|---|---|---|
S&P TSX | 5.9% | 7.3% | 12.3% |
S&P 500 | 1.2% | 10.0% | 16.7% |
Nasdaq | -0.8% | 12.4% | 17.2% |
WTI Oil | -5.9% | -6.7% | 8.4% |
Natural Gas | -21.7% | 2.3% | -19.0% |
10-Year US Treasury Bond | 3.4% | 6.5% | 1.2% |
USD/CAD FX | 1.0% | 0.2% | 4.3% |
Source: FactSet
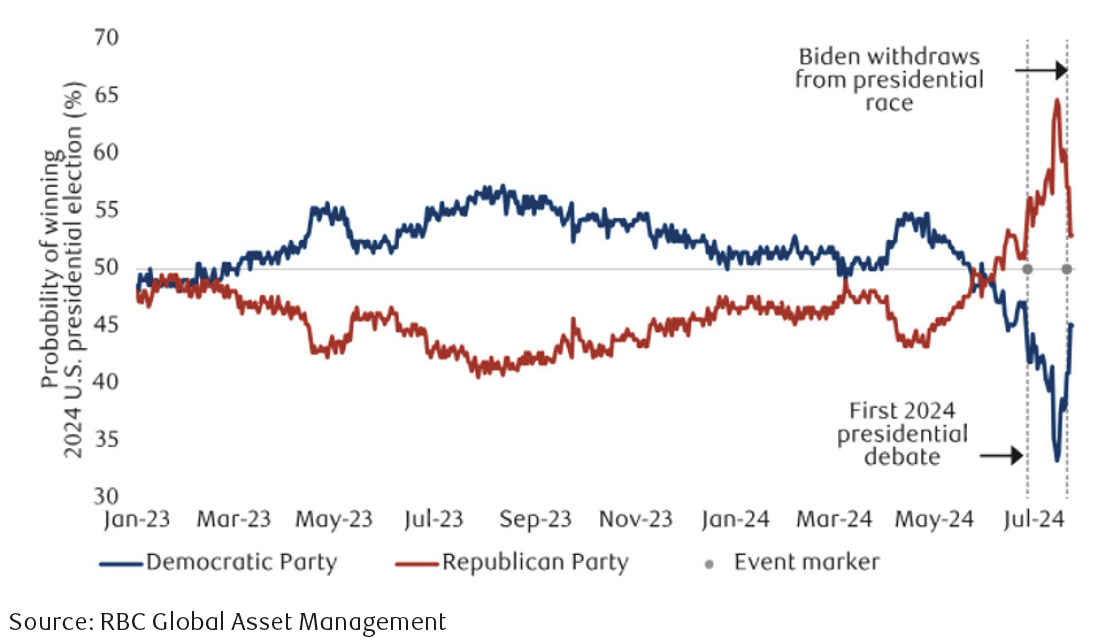
On July 13, former President Trump survived an assassination attempt and the nation rallied around his recovery. Just days later oddsmakers assigned a 65% probability of Trump winning the presidential election followed by the incumbent Biden (15%), Harris (9%), Newsom (3%), and so on. The likelihood of a Republican sweep seemed very plausible at the time, but that has since reversed course. On July 21, President Biden dropped out of the presidential race and endorsed Kamala Harris as the Democratic nominee. According to her campaign, they raised more than $200 million in the first week of fundraising with 66% of the funds raised coming from first-time donors. According to RBC Global Asset Management, the odds of Kamala Harris winning the presidency has continued to increase and now sits at 45.5% relative to Trump’s 54.5% (Chart 1).
Chart 1: Odds of a Trump presidency have fallen
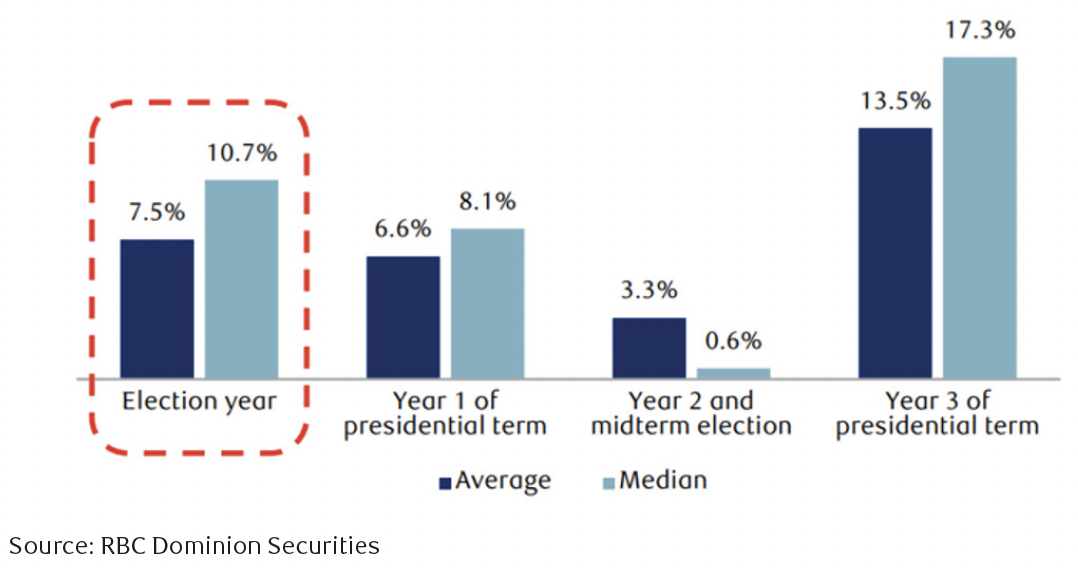
With plenty of noise surrounding the U.S. election, how could the results potentially impact your portfolio? Chart 2 showcases the importance of remaining invested despite political uncertainty. Since 1928 the median return in an election year has been 10.7%, followed by 8.1% in the first year of a presidential term. This is certainly backward-looking, but it does provide some comfort in knowing markets have historically performed well during these seemingly turbulent periods.
Chart 2: S&P 500 performance during presidential election cycles since 1928
What could be the potential market implications under a Trump or Harris presidency? Chart 3 demonstrates the vastly different views on policy between the two candidates. Domestically, Trump plans to cut corporate tax rates from 21% to 15%, whereas Harris has proposed to hike corporate tax rates to 35%. Although the Federal Reserve should always operate independently of the White House, Trump also has a history of pressuring the Chair to keep interest rates low to stimulate economic growth. There certainly are short-term positives for investors and businesses if Trump’s domestic policy agenda comes to fruition.
Despite the potential near-term “Trump Bump,” there are negative longer-term implications for financial markets surrounding his highly inflationary policies. Cutting taxes, pressuring for lower interest rates, anti-immigration, and protectionist trade policies could certainly lead to another battle against inflation. Of course, a Republican sweep is not as likely as it once was, and presidents very rarely get to do everything they desire. In our view, this outcome is far from ideal with the best-case scenario for financial markets being the current status quo. Gridlock in Washington is welcomed given a mixed congress would make it difficult to implement any new radical policies proving to be inflationary under Trump or potentially contractive with Harris. According to RBC Global Asset Management, the odds of a divided Senate and House is now highly probable.
Chart 3: Potential election implications under a Trump or Harris presidency
2024 U.S. Election | Donald Trump | Kamala Harris |
|---|---|---|
Domestic Economy |
|
|
Trade |
|
|
Foreign Affairs |
|
|
Immigration |
|
|
Environment |
|
|
Overall |
|
|
Source: RBC Economics, Troy Wealth Management
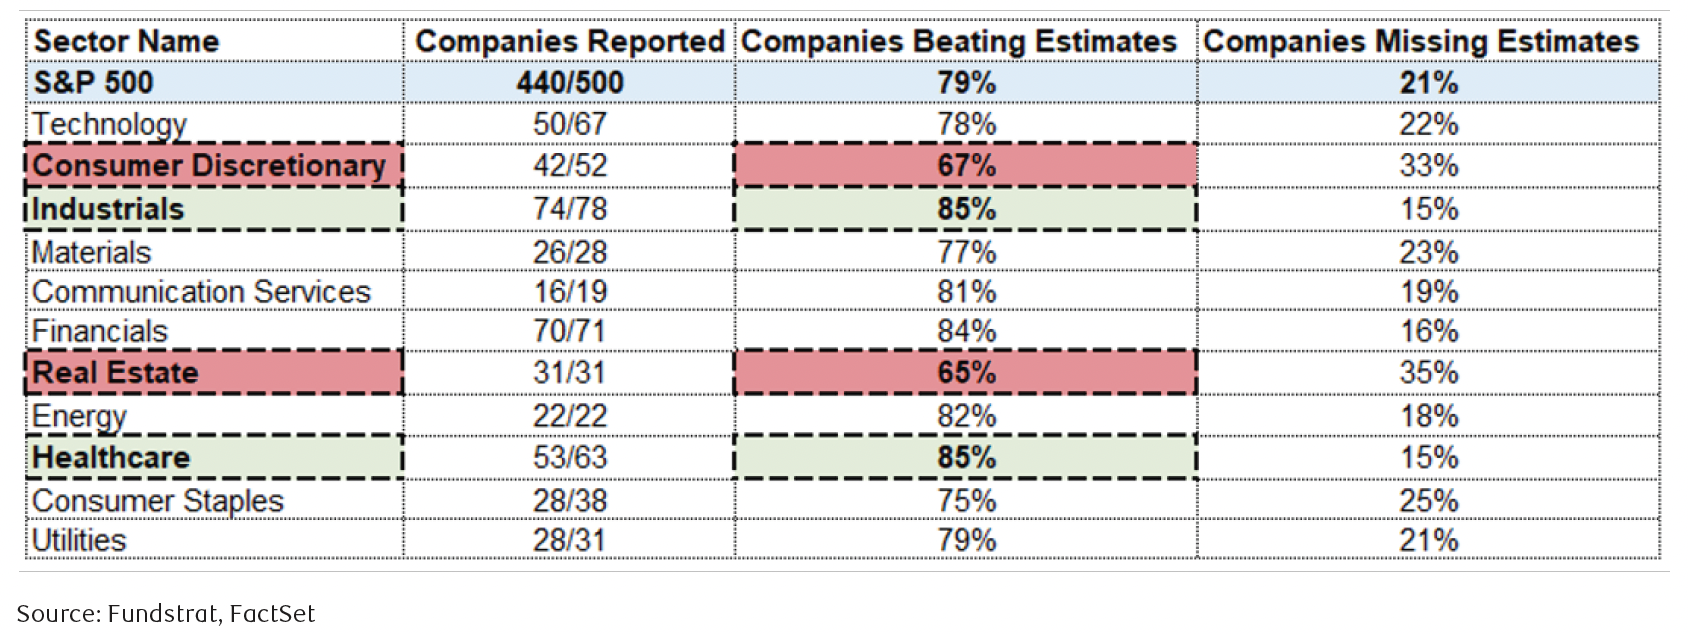
We are currently at the tail-end of earnings season and the reports have been better than expected. In the S&P 500, 440 companies or 88% of the index has reported thus far. Overall, 79% are beating expectations by a median of 6% and forward-looking guidance has been well-received. The 21% of stocks falling short of quarterly estimates are missing by a median of -5%. Positive earnings surprises at a sector level have been led by the industrials and healthcare areas of the market (Chart 4). 85% of companies in those two sectors have reported earnings more robust than consensus estimates. The real estate sector was comparatively weaker relative to other constituents in the index, with just 65% of companies beating estimates. Consumer discretionary earnings results also came in a bit lighter than other sectors and we will continue to keep a close eye on potential opportunities to take advantage of.
Chart 4: The S&P 500 and Nasdaq Composite are tech-focused
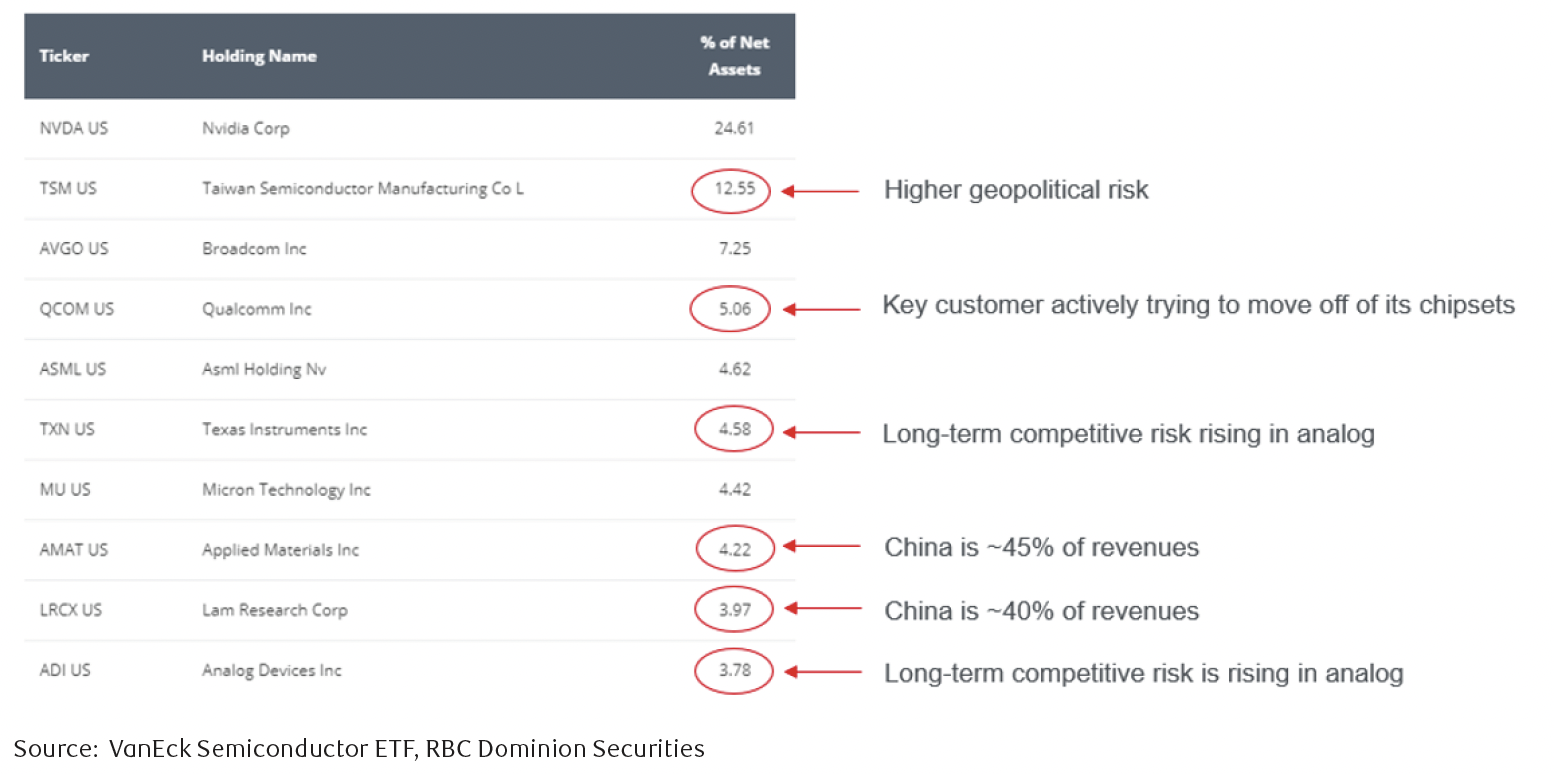
Diversification is the process of adding investments to a portfolio in which the risk-reward tradeoff improves. Our firm has an internal advisory group and they recently presented on the topic of Di-“worse”- ification. Di-“worse”-ification results from investing in too many assets with similar correlations that can actually increase the risk of a portfolio without enhancing the return prospects. Further, there are varying levels of quality within companies located in a sector or even sub-sector. For example, does this business have stronger economic positioning relative to their competitors? Have they been growing faster? Is the management team competent and aligned with shareholders? Is the profitability superior? How about the financial health and balance sheet? Is the company well capitalized and able to meet any sort of short-term obligations? Is there ample cash on hand? What about the valuation? Is the company reasonably priced given its outlook? These are the sort of questions we ask ourselves when determining which businesses fit within client portfolios and why running a concentrated portfolio of quality companies makes more sense to us than adding hundreds of different ideas. Chart 5 is a sub-sector semiconductor ETF which owns 26 different stocks. We would rather own the best determined businesses of the group (whether it be one or two) versus all 26. In our opinion owning each and every business in a category would worsen the quality of our overall investments while lowering the risk-reward tradeoff within our client portfolios.
Chart 5: Di-“worse”-ification leads to quantity over quality
As we move into autumn – a season that has historically brought its fair share of financial turbulence – we see some valuations elevated and earnings likely to face some pressure in the near term, hence leaving equity markets in a bit of a holding pattern. This does not mean that certain stocks and sectors will not perform well, rather, the leadership could come from less flashy, more defensive companies with more modest valuations versus the high growth stocks that have previously driven the market.
We will keep a watchful eye on what the next few months bring and are prepared to capitalize on opportunities to strengthen our portfolios. In the meantime, we hope you enjoy the final few weeks of the summer.