June 2024 Market Commentary
The month of June proved to be a very strong month for U.S. equity investors with the Nasdaq Composite and S&P 500 returning +6.0% and +3.6%, respectively. The S&P TSX trailed, posting a negative return of -1.4%. With major equity indices now trading at or near all-time highs, does it make sense to wait for a potential pullback before investing? Should investors sell-down their portfolio and raise cash? This is a common misconception among many market participants.
The month of June proved to be a very strong month for U.S. equity investors with the Nasdaq Composite and S&P 500 returning +6.0% and +3.6%, respectively. The S&P TSX trailed, posting a negative return of -1.4%. With major equity indices now trading at or near all-time highs, does it make sense to wait for a potential pullback before investing? Should investors sell-down their portfolio and raise cash? This is a common misconception among many market participants.

Troy Private Wealth Partners
June 29, 2024
The month of June proved to be a very strong month for U.S. equity investors with the Nasdaq Composite and S&P 500 returning +6.0% and +3.6%, respectively. The S&P TSX trailed, posting a negative return of -1.4%. With major equity indices now trading at or near all-time highs, does it make sense to wait for a potential pullback before investing? Should investors sell-down their portfolio and raise cash? This is a common misconception among many market participants.
Index | May | 3-Month Trailing | YTD Return |
|---|---|---|---|
S&P TSX | -1.4% | -0.5% | 6.1% |
S&P 500 | 3.6% | 4.3% | 15.3% |
Nasdaq | 6.0% | 8.3% | 18.1% |
WTI Oil | 7.6% | -1.4% | 15.2% |
Natural Gas | 0.5% | 47.5% | 3.5% |
10-Year US Treasury Bond | 1.2% | -0.5% | -2.1% |
USD/CAD FX | 0.4% | 1.0% | 3.3% |
Source: FactSet
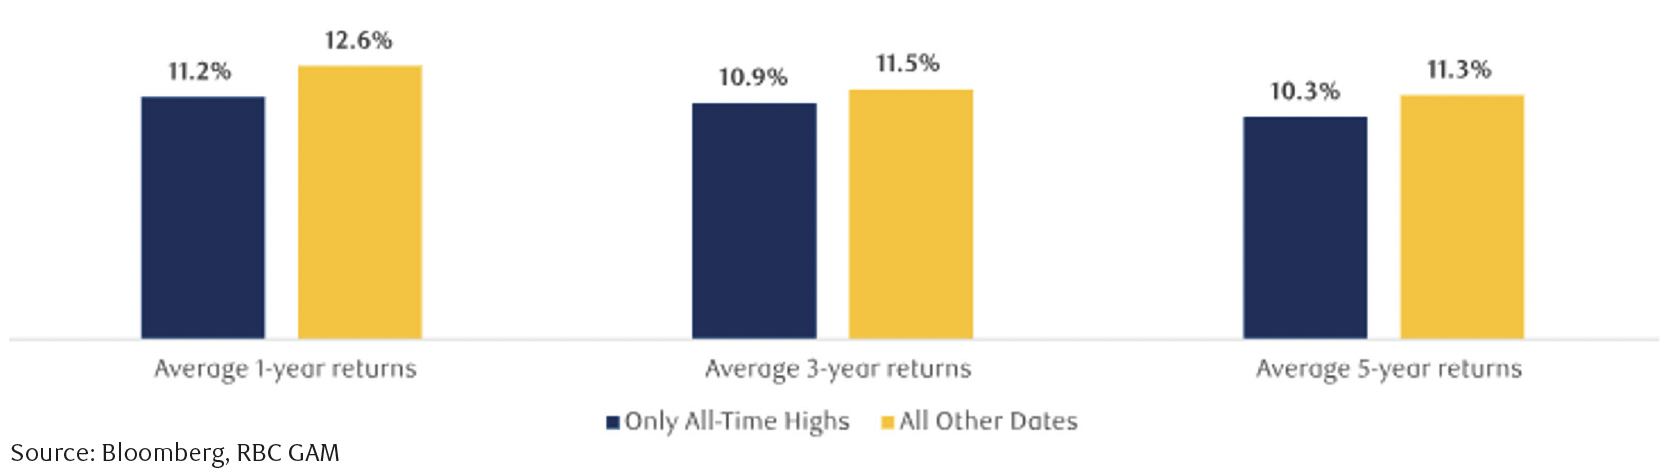
Since 1950 how would you have done on average if you had invested only at market peaks in the S&P 500? In other words, investing at the perceived “worst possible time.” Below is a chart showcasing how an investor would have performed investing only at all-time highs versus all other dates. On a rolling 1, 3, and 5-year basis (annualized), your portfolio would have returned +11.2%, +10.9%, and +10.3%. The delta investing at market peaks versus any other trading day is not as insufferable as initially thought. It’s crucial to understand that time in the equity market is far more important than time out of it.
Chart 1: Investing at all-time highs should not be feared
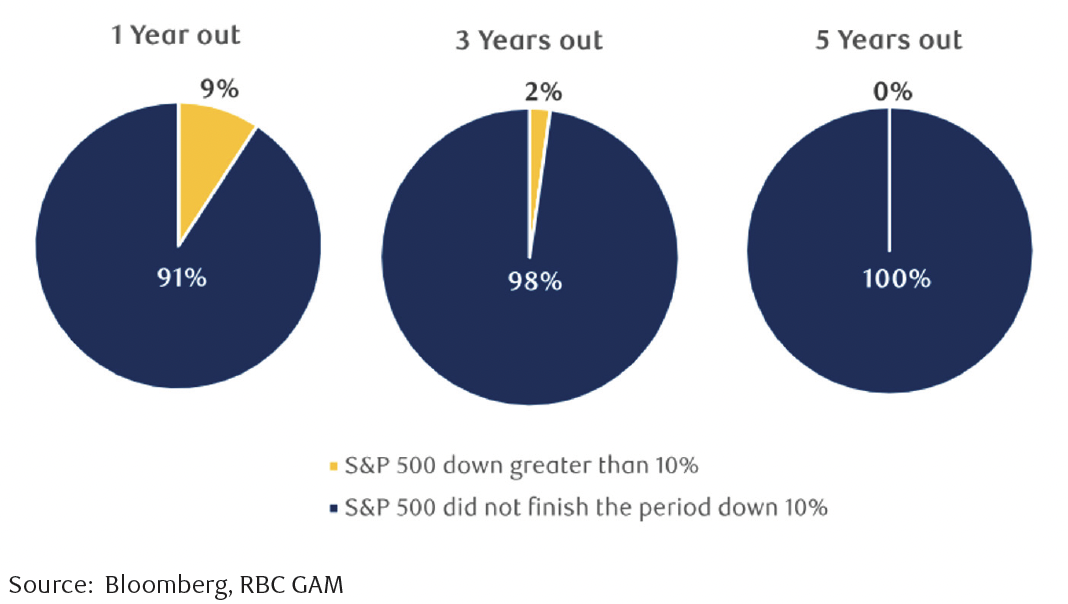
How often does a large market correction occur once all-time highs are reached? Chart 2 depicts how often the S&P 500 has fallen more than 10% after investing at a market peak on a rolling 1, 3, and 5-year basis. Since 1950, your portfolio would have fallen more than 10% just 9%, 2%, and 0% of the time, respectively. Empirically, the probability of investors bearing a large market correction following market peak investing seems rather favourable. Of course, past returns are not indicative of future results, but this data does seem quite reassuring.
After one year investing at a peak, market corrections greater than 10% has happened just 9% of the time. The data further tells us the importance of patience and investing for the future. A market correction can be difficult in the moment, but stocks do tend to trade higher over the long-term. It’s important for investors to remember that all-time highs are a very normal occurrence, and it does not necessarily signal a pending drawdown in your portfolio – The odds are in your favour.
Chart 2: Probability of market corrections following all-time highs
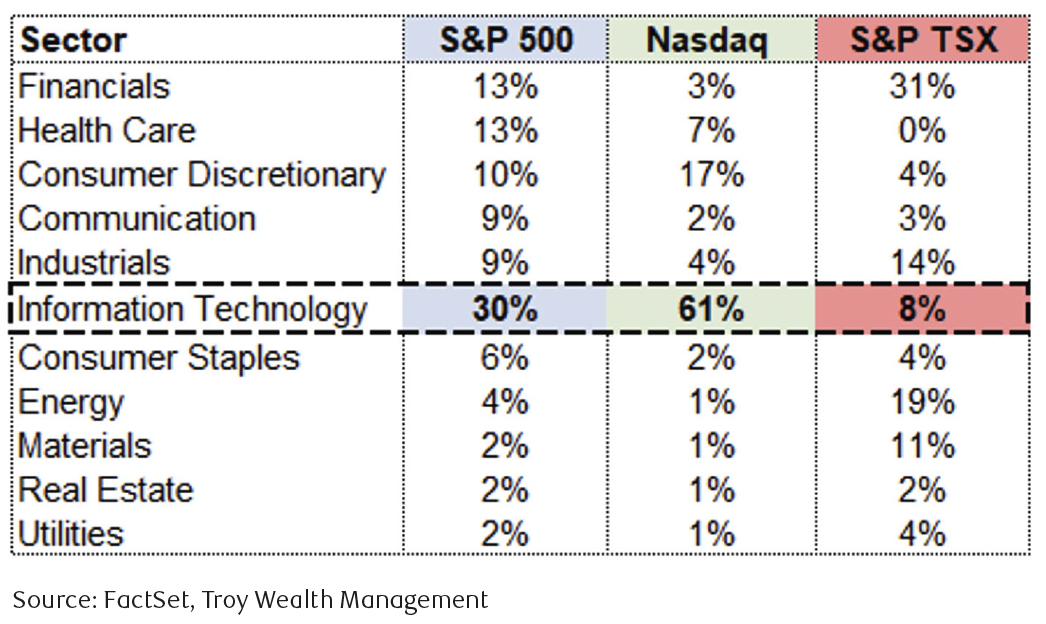
Our team has been actively increasing its U.S. equity exposure for clients. American indices such as the S&P 500 and Nasdaq Composite have steadily outperformed the Canadian S&P TSX over the last couple years (Chart 3). 50% of the Canadian index is concentrated in the Financials (31%) and Energy (19%) sectors (Chart 4). Investing outside of Canada and in the U.S. gives us exposure to high growth businesses focused on technology advancement such as Artificial Intelligence (AI). Apple, Alphabet, Amazon.com, Meta Platforms (formerly Facebook), Nvidia, and Microsoft are leading the charge. These companies represent ~ 30% of the S&P 500 and ~ 50% of the Nasdaq Composite, which led to the staggering relative outperformance against the S&P TSX which does not own any of these names. Broadly speaking, businesses are investing heavily in artificial intelligence with a desire to make their companies more cost efficient and faster growing.
For example, let’s assume a retail business has decided to implement AI for both growth and inventory cost management. AI algorithms can analyze historical sales data, market trends, and seasonal patterns to more accurately forecast demand (minimizing overstock, holding costs, and lost sales). AI can automate the entire reordering process based on real-time sales data. This will reduce manual labour costs while ensuring inventory levels remain optimal.
AI can also enable businesses to potentially grow faster through analyzing customer data to identify purchasing patterns and preferences. The retail business can engage with customers online to create custom recommendations or personalized campaigns to potentially increase their sales along with building brand loyalty. AI can also adjust prices dynamically in real-time based on current demand, competition, and other factors management deems important. AI-powered chatbots and virtual assistants could also handle all queries 24/7, potentially improving customer satisfaction while saving on labour costs.
In this one example of a retail business enabling AI, we can quickly understand why there has been explosive growth in this space. Cost savings, potential revenue growth, efficiency gains, and customer satisfaction can all potentially improve drastically.
Businesses we own in client portfolios will benefit from global AI adoption.
Chart 3: The Canadian S&P TSX has struggled to keep pace
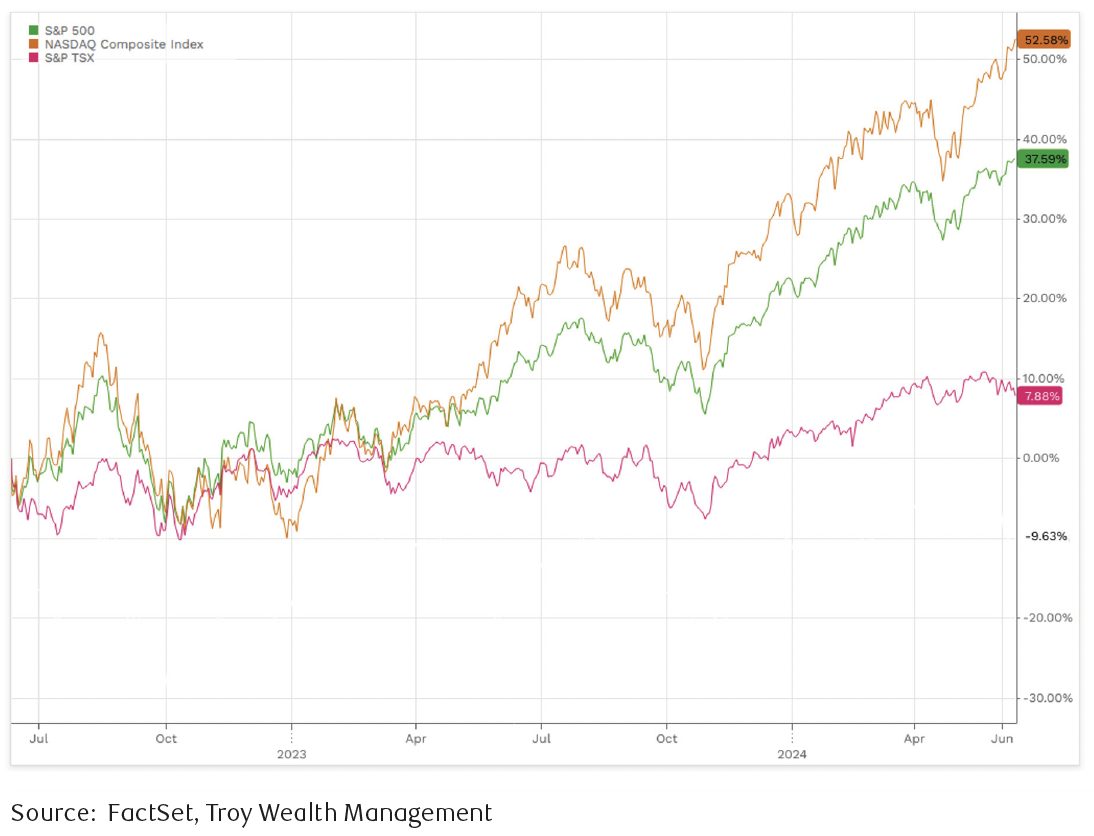
Chart 4: The S&P 500 and Nasdaq Composite are tech-focused
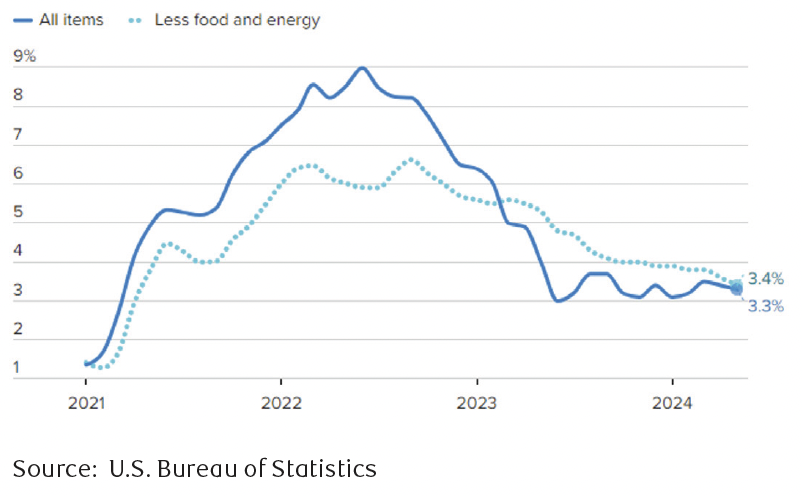
At the time of writing this market commentary we had timely inflation data released by the United States. The headline U.S. Consumer Price Index (CPI) which includes food and energy prices grew just 3.3% YoY. For context, this figure was north of 9% almost two years ago exactly (Chart 5). The central bank’s rapid hiking of interest rates mixed with quantitative tightening has successfully tamed the wrath of inflation to this point.
Chart 5: YoY U.S. headline inflation has fallen from 9.1% in 2022 to most recently 3.3%
With inflation seemingly under control, the market has urged central banks to begin easing financial conditions. According to RBC Capital Markets, in Canada there is close to $1 trillion worth of mortgages at chartered banks set for renewal over the next couple years. Mortgage payments are set to spike on average between 32-48% through 2024-2026, but as high as 63% if interest rates remain elevated at these levels towards the tail-end of 2026. This undoubtedly will have a profound impact on the Canadian consumer and businesses alike, and we have been positioning accordingly.
With inflation coming down and future economic growth now a concern, the Bank of Canada (BoC) has begun their expansionary monetary policy.
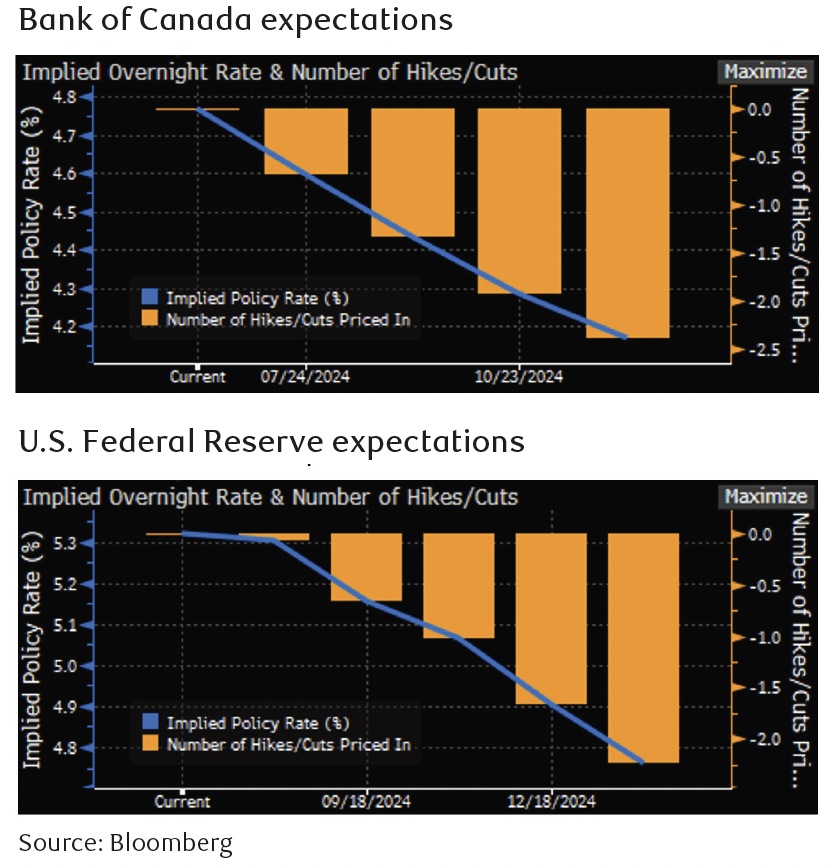
On June 5 the BoC cut their policy rate from 5% to 4.75% and there is currently a ~ 70% probability we will see another rate cut in the upcoming July meeting. The street is projecting we see an additional 2-3 cuts by year end, leaving the implied policy rate around 4.2%. The United States has been more resilient than Canada and does not face the same structural problems (mortgages can be fixed for 30 years in the U.S.). However, financial conditions are also tight in the U.S. and expected to ease beginning sometime in the second half of this year. In 2024, analysts are now expecting one to two cuts in the U.S. versus the potential for four cuts in Canada (Chart 6).
Chart 6: Interest rate expectations remain dovish
In May we also saw a slew of businesses we own report their quarterly earnings and the results were impressive. As we enter the second half of the year, there are a few companies we are keeping a close eye on to potentially initiate in client portfolios. If we see any weakness over the next couple months, our team sees it as an opportunity for us to further bolster your portfolios with names that have high long-term conviction.