
Troy Private Wealth Partners
November 29, 2024
With the uncertainty of the U.S. presidential election finally behind us, equity markets soared in November. The S&P TSX led the charge (+6.4%) followed by the Nasdaq Composite (+6.2%) and S&P 500 (+5.9%). As mentioned in some of our previous commentaries, the Canadian S&P TSX is 31% exposed to the financials sector versus the S&P 500 at just 13%. This sector performed particularly well in November (+7.5%) which led to the relative TSX outperformance. Vastly improved economic sentiment, incoming U.S. deregulation (most Canadian financials have a U.S. footprint), and supportive monetary policy contributed to the gains.
Index | November | 3-Month Trailing | YTD Return |
|---|---|---|---|
S&P TSX | 6.4% | 10.7% | 25.8% |
S&P 500 | 5.9% | 7.2% | 28.1% |
Nasdaq | 6.2% | 8.5% | 28.0% |
WTI Oil | -1.9% | -8.4% | -5.1% |
Natural Gas | 24.2% | 58.1% | 33.8% |
10-Year US Treasury Bond | 1.3% | -1.2% | 1.4% |
USD/CAD FX | 0.5% | 3.8% | 5.7% |
Source: FactSet
On November 25, President-elect Donald Trump announced his intention to impose a 25% tariff on all imports from Canada and Mexico while adding an additional 10% to all Chinese goods. He stated that this measure would be implemented through an executive order upon his inauguration on January 20, 2025. The proposed tariffs aim to pressure these countries to address issues related to illegal drug trafficking, particularly fentanyl, and illegal immigration into the United States.
Is Trump posturing? Should we take the possibility of higher U.S. tariffs on Canadian exports, a cornerstone of the Trump 2.0 agenda, seriously? Let’s assume the worst and examine the potential impact to your portfolio.
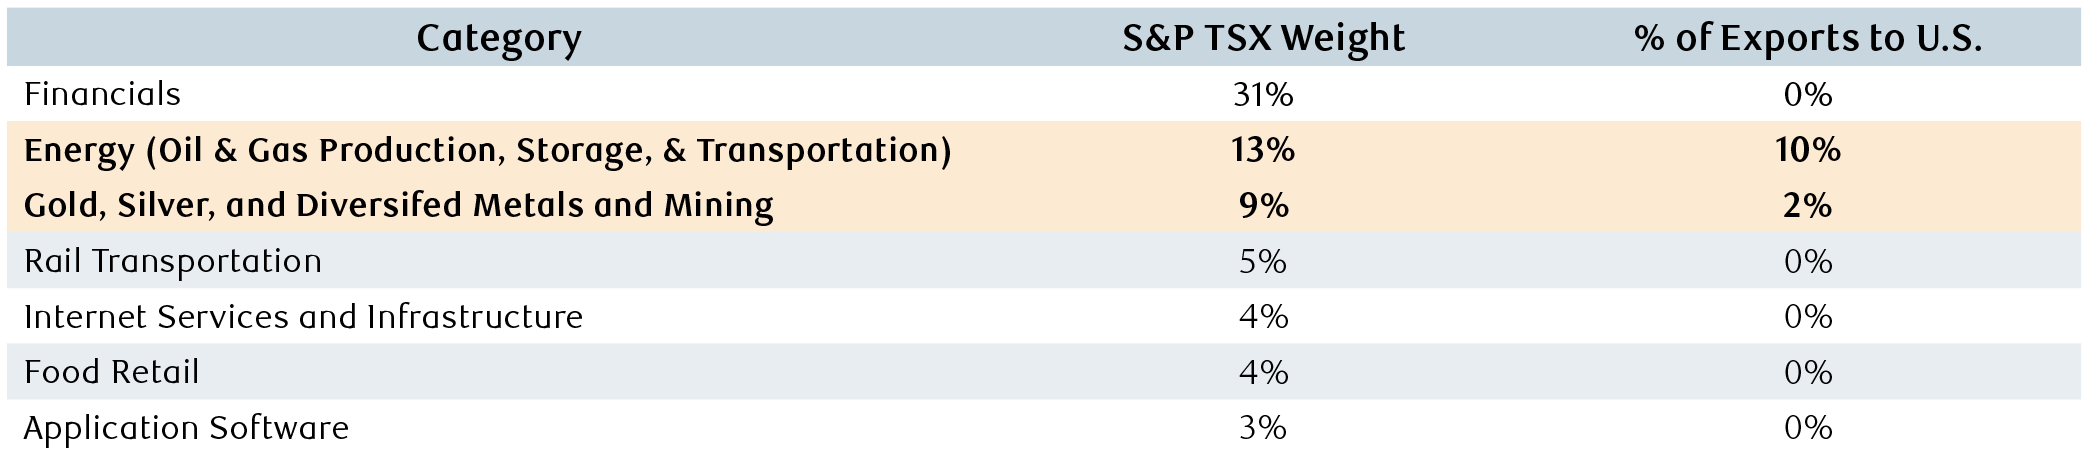
Chart 1 displays various S&P TSX sector weights and their corresponding percentage of exports to the United States. The Canadian stock market appears to be quite insulated from tariffs due to (1) the largest index sectors being more service-based and (2) a portion of our exports are manufactured outside of Canada. For example, Canadian exported automobiles/parts, pharmaceuticals, and electronics are predominantly manufactured by Japanese, U.S., or European firms. Further, major sectors in the Canadian stock market such as financial services, internet companies, food retailers, and application software are not directly exposed to tariffs as they do not rely on physical exports to the U.S.
However, Canada’s significant exports of oil and precious metals to the U.S. (industries that carry notable weight in the S&P TSX) could drag returns if targeted by tariffs. Additionally, Canadian rail companies might face headwinds if reduced commodity exports to the U.S. lower transport demand. Also, it’s important to note that although the TSX seems rather insulated to U.S. tariffs, there could be a negative ripple effect on the economy as a whole.
Chart 1: The Canadian stock market is fairly insulated to Trump’s proposed tariffs
Source: Bloomberg Intelligence, RBC Dominion Securities
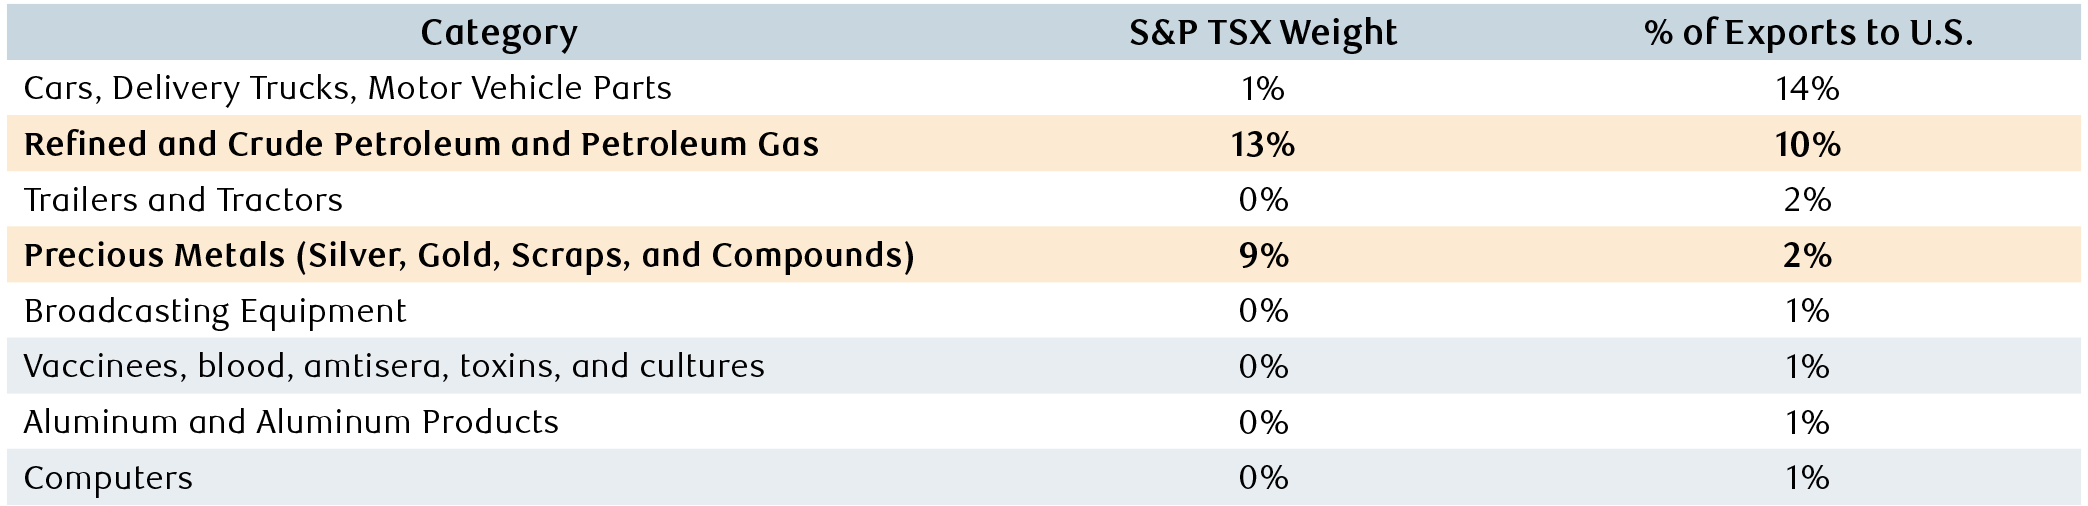
Chart 2 further demonstrates the differences between the Canadian economy its stock market. Canadian goods exports to the U.S. totaled nearly $550 billion over the last year. Energy exports to the U.S. represents nearly a third of their imports, crowning the sector by far the largest contributor. If we step back and assess the feasibility of imposing tariffs on Canadian energy, the move is puzzling. Given the lack of viable short-term alternatives to the more than three million barrels of oil imported daily by the U.S., which is roughly 20% of their overall oil consumption, the most immediate effect of such measures would result in higher energy prices for U.S. consumers. President-elect Trump’s campaign focused on lowering energy prices and inflation for Americans, however his stance on tariffs is seen as highly contradictory.
Further, our RBC Capital Markets analysts would be surprised if the U.S. does not make concessions on the energy front given their dependence on Canada for our heavy oil. Tariffs would not only impact oil producers in Canada but also the pipelines that ship oil to the U.S. Due to Trump’s protectionist behaviour in his last term, energy names in Canada began shipping more product outside of the U.S. leaving these businesses better prepared this time around.
Chart 2: The largest Canadian export category to the U.S. is a small component of the S&P TSX
Source: Bloomberg Intelligence, RBC Dominion Securities
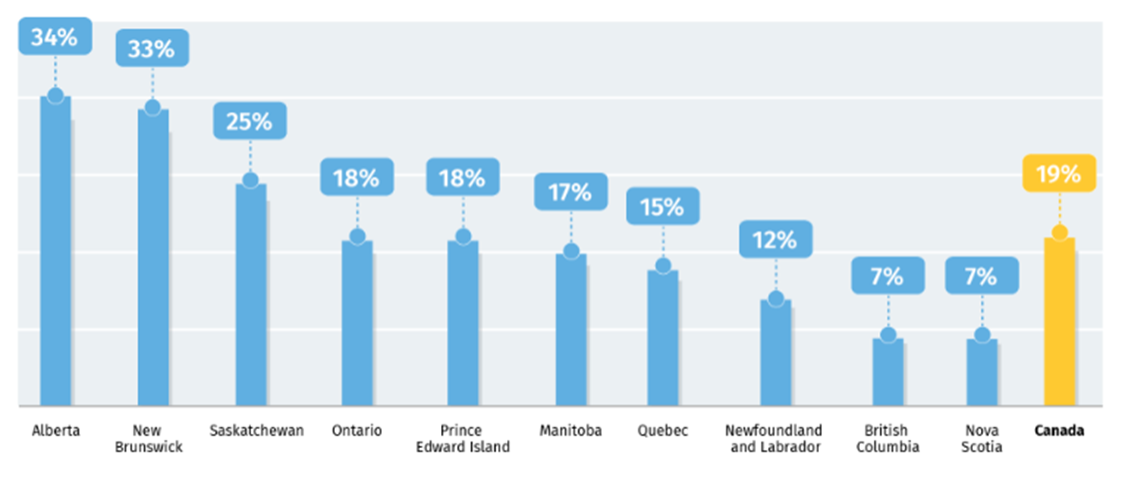
On a provincial level our merchandise exports to the U.S. as a share of provincial GDP is the highest in Alberta, New Brunswick, and Saskatchewan. Our economic prosperity in those provinces and Canada as a whole relies heavily on U.S. consumption – hopefully we can avert these proposed tariffs and work efficiently with our largest trading partner to promote economic growth on both sides of the border. Working against one another versus together seems rather unproductive and contractive to both Canada and the U.S.
Chart 3: Merchandise exports to the U.S. as share of provincial GDP
Source: Statistics Canada, RBC Economics Research
Our overall takeaway is that higher U.S. tariffs on imports, a cornerstone of the Trump 2.0 agenda, should be taken genuinely - even if elements of posturing are evident. Trump’s tariff proposals, while troubling, are neither a guarantee nor likely to be permanent. Trump trade disputes have transpired before and any tariffs actually implemented are likely to serve as bargaining leverage rather than lasting policy. Negotiations or amendments to existing trade agreements have frequently led to their reduction or removal. Canada has already begun to make concessions to President-elect Trump which includes a CAD $1.3 billion investment over six years to bolster border security.
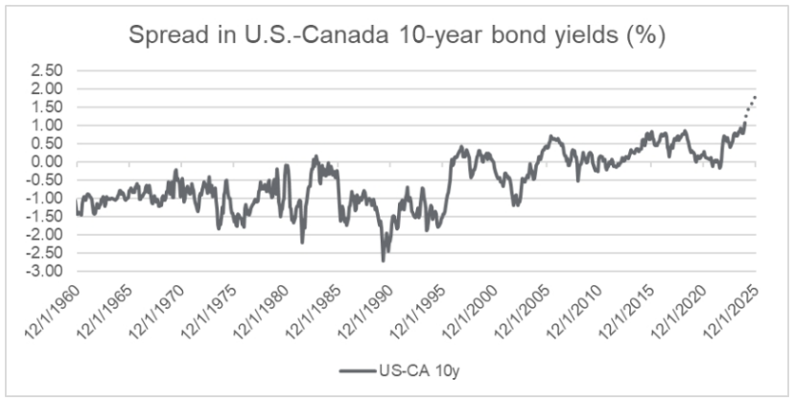
Clients more recently have been asking about the Canadian dollar and if we could see some improvement next year. With the dollar tumbling to a near five-year low against the greenback (1.44 CAD to the U.S. dollar or 0.69 U.S. cents), a few catalysts will need to reverse course. Interest rate differentials need to tighten, not widen. The U.S. hiked interest rates at a much faster level than Canada and they have been cutting at a much slower pace. From a return potential, the higher interest rates in the U.S. attract more investment and can also signal stronger economic growth - which has certainly been the case. Interest rates and economic growth are major determinants to currencies, and both have played a major role in the weakening Loonie. On the long-end of the yield curve, Chart 4 shows the current and projected spread in 10-year U.S. and Canada bond yields. The U.S. 10-year is yielding 1.25% higher and RBC Capital Markets expects it to widen even further. The threat of U.S. tariffs is also a headwind to our dollar and it doesn’t help to lose key members of Prime Minister Trudeau’s cabinet ahead of intense trade negotiations (Chrystia Freeland resigned as Finance Minister on December 16). Lastly, in times of global economic uncertainty investors see the U.S. dollar as a “safe-haven.” This increases the demand for the USD, pushing it higher in value against other global currencies such as the Canadian dollar.
The DXY index (pronounced the “dixie”) measures the U.S. dollar against a basket of foreign currencies. The DXY has strengthened nearly 8% in just the last three months, signifying strong foreign investment into the U.S. since betting markets predicted the victory of President-elect Trump. The Japanese multinational holding company SoftBank for example just announced a USD $100 billion investment into the U.S. with talks of increasing the size to USD $200 billion.
RBC Capital Markets has a currency desk which specializes in forecasting FX rates. Our analysts believe the Canadian dollar will weaken to 1.45 CAD per U.S. dollar in the first half of 2025. By the end of next year, they predict the Canadian dollar will then strengthen to 1.40 CAD per U.S. dollar. Rationale? The monetary easing delivered by the Bank of Canada should hopefully support a rebound in growth. If tariff talks progress positively, a weak Loonie makes it cheaper for American businesses and consumers to import Canadian products. This should hopefully put some upward pressure on the Canadian dollar and its economy.
Chart 4: The current and projected spread in 10-year bond yields is unprecedented
Source: Bloomberg, RBC Dominion Securities
Investment Highlight

We have been investing in the private debt space for clients through top-tier credit managers such as Howard Marks’ Oaktree Capital Management. Oaktree is a leading global alternative asset manager with USD $205 billion in assets and over 1,200 employees.
The Oaktree Strategic Credit Trust (the “Fund”) seeks to invest in a diversified portfolio of income-generating private credit opportunities, with the flexibility to invest in high-quality public debt. The public debt component seeks to enhance total return and provide liquidity during periods of market dislocation. Oaktree has a fantastic track record with a strong expertise in managing these credit investments over multiple market cycles. The Fund dynamically shifts allocations to different private and public opportunities in response to changing market conditions. Oaktree also focuses on preserving capital for their investors and the investment team is skilled at recovering client capital when things don’t go perfectly – albeit a very rare situation for this product.
In relatively calm or “benign” markets, the Fund generally has a higher allocation to private credit, which is designed to generate income and mitigate risk. In periods of stress or “dislocated” markets that can cause the mispricing of assets, the Fund will increase its allocation to public investments, seeking to capture total-return opportunities.
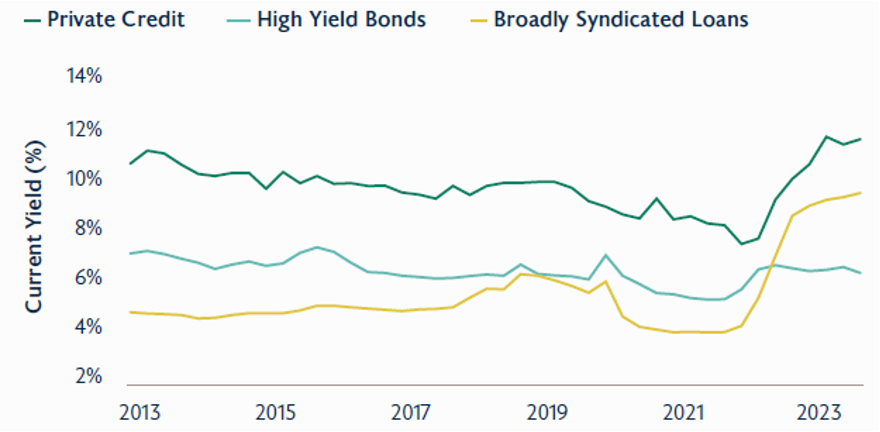
Chart 5 highlights the current yields across Oaktree Strategic Credit Trust’s investment portfolio. Private credit, high yield bonds, and broadly syndicated loans are yielding roughly 12%, 6%, and 9%. The blended yield (net of fees) for the Fund is currently 10.19% which offers compelling income for our clients - Yields are only indicative and subject to change.
Chart 5: Oaktree Strategic Credit Trust offers a diversified 10.19% net yield (subject to change)
Source: Oaktree Capital Management
As we close out the year, we want to express our gratitude for the trust you have placed in us throughout 2024. Your dedication and accomplishments inspire us to do what we do, and it has been an honour to support you in achieving your goals.
December is a time to celebrate milestones and plan for what’s ahead. We are excited to continue working alongside you in 2025, delivering the service and solutions you need to succeed in the long-run.
From all of us, we wish you a wonderful holiday season filled with joy, relaxation, and time with loved ones. Thank you for allowing us to support you this past year – we can’t wait to see what 2025 has in store.
Warm Regards,
Andrew Troy