September 2024 Market Commentary
In our last market commentary, we discussed the typical seasonal weakness investors experience in August through October. History has not repeated itself thus far, with September proving to be a continuation of strong equity performance. With so much uncertainty in the world, it’s remarkable to see such resilience in markets. Broadly speaking, company earnings are growing, guidance has largely remained in-line or raised, and central banks in economies such as Canada, the United States, and most recently China has turned dovish.
In our last market commentary, we discussed the typical seasonal weakness investors experience in August through October. History has not repeated itself thus far, with September proving to be a continuation of strong equity performance. With so much uncertainty in the world, it’s remarkable to see such resilience in markets. Broadly speaking, company earnings are growing, guidance has largely remained in-line or raised, and central banks in economies such as Canada, the United States, and most recently China has turned dovish.

Troy Private Wealth Partners
September 29, 2024
In our last market commentary, we discussed the typical seasonal weakness investors experience in August through October. History has not repeated itself thus far, with September proving to be a continuation of strong equity performance. With so much uncertainty in the world, it’s remarkable to see such resilience in markets. Broadly speaking, company earnings are growing, guidance has largely remained in-line or raised, and central banks in economies such as Canada, the United States, and most recently China has turned dovish.
Index | September | 3-Month Trailing | YTD Return |
|---|---|---|---|
S&P TSX | 3.2% | 10.5% | 17.2% |
S&P 500 | 2.1% | 5.9% | 22.1% |
Nasdaq | 2.7% | 2.6% | 21.2% |
WTI Oil | -7.7% | -17.0% | -4.4% |
Natural Gas | 37.4% | 12.4% | 16.3% |
10-Year US Treasury Bond | 1.3% | 6.2% | 4.0% |
USD/CAD FX | 0.2% | -1.1% | 2.1% |
Source: FactSet
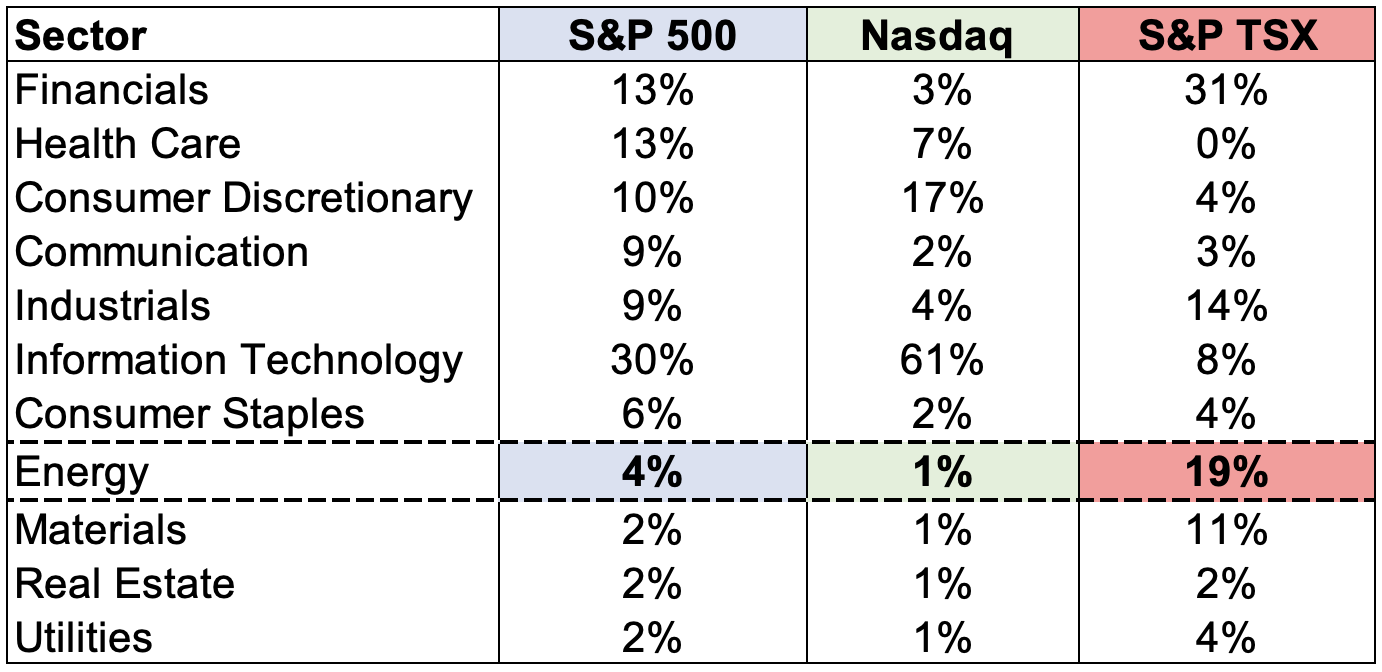
The Canadian S&P TSX led the charge in September (+3.2%) followed by the Nasdaq Composite (+2.7%) and S&P 500 (2.1%). The S&P TSX is a resource-heavy index (Chart 1), and the performance in natural gas was certainly a contributor to the Canadian relative outperformance. Steady demand combined with slight production declines created favourable natural gas market conditions. Catalysts such as warmer than normal temperatures across much of the U.S. along with hurricane disruptions/ anticipation led to strengthening natural gas pricing throughout September. Oil on the other hand performed poorly in September, but the underlying energy names generally traded higher. Rising global conflict mixed with OPEC+ production cuts of 2.2 million barrels per day (b/d) has likely put somewhat of a floor on falling WTI prices. However, at the time of writing this commentary, OPEC+ cut their 2025 global oil demand growth outlook which has weighed on the sector thus far in October.
Chart 1: The Canadian S&P TSX is resource-rich
Source: FactSet
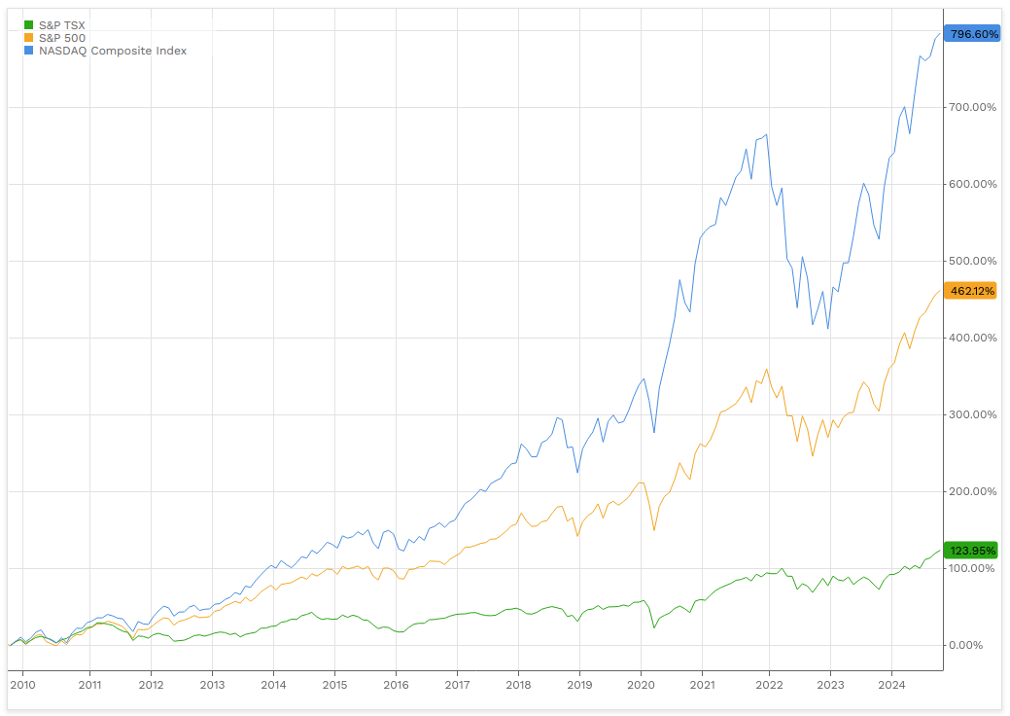
A home country bias occurs when an investor has a tendency to invest the majority of their portfolio in domestic investments. When it comes to investing, especially in Canada, avoiding a home country bias has had a significantly positive impact on returns. Our discretionary client portfolios are invested globally instead of exposure to just our local Canadian economy. This has served us well, as the Canadian S&P TSX has historically not kept pace with its American counterparts (Chart 2). Over the last 15 years on a cumulative total-return basis, the tech-heavy Nasdaq composite and S&P 500 have returned +796.6% and 462.12%, respectively. On the other hand, the S&P TSX has returned +123.95% which is comparatively much lower.
Why is there such staggering relative underperformance in our Canadian index? Investing in the U.S. for example gives us exposure to highly successful and growing businesses in areas vastly underrepresented in the Canadian market. This could include artificial intelligence (AI), cyber security, cloud computing, Internet of Things (IoT), biotechnology or even the healthcare sector as a whole. Canada’s market has underwhelming exposure to these sub-sectors, especially when it comes to technological advancement. In a general sense, investing in Canada is more of a value investment given roughly 50% of the index is in the Financials and Energy sectors. These two sectors are more mature/slower growing but offer compelling dividend yield.
It’s not to say Canadian stocks should never be owned. For Canadians from a tax standpoint, foreign income (such as U.S. dividend income) is subject to withholding taxes and treated as ordinary income. On the other hand, Canadian dividend income receives preferential tax treatment. A more tax-efficient income stream can help us better achieve our desired lifestyle, whether it’s now or in the future. Many quality Canadian companies we own are great dividend growers such as Royal Bank (3.5% yield), Canadian Natural Resources (4.5% yield), and TC Energy Corporation (6.0% yield) to name a few.
Chart 2: The Canadian S&P TSX has not kept pace
Source: FactSet
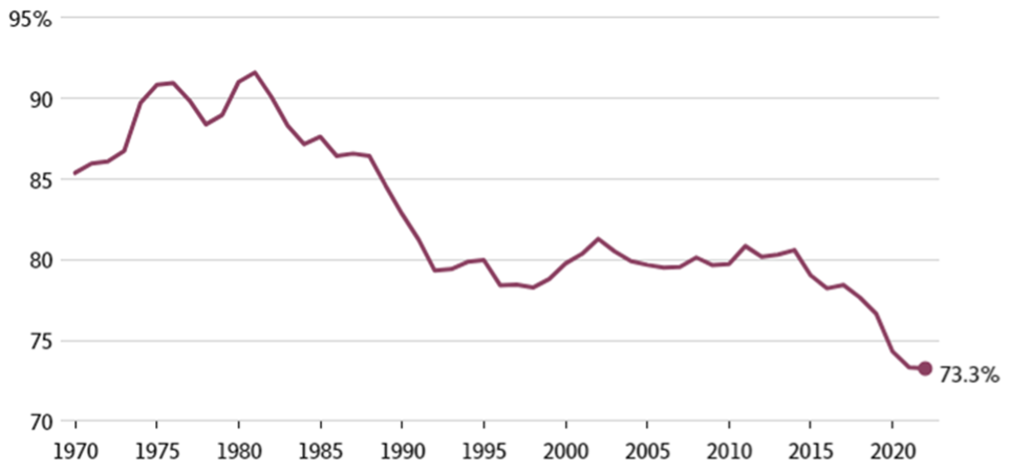
Further explaining Canada’s relative underperformance is due to our struggling economic growth. A nation’s GDP is the total value of all goods and services produced within the country. The GDP per capita is calculated by dividing the country’s GDP by its population, which gives us the economic output per person. Canada’s GDP per capita expressed as a percentage of the United States has struggled to keep pace, and has fallen to a dismal 73.3% (Chart 3).
GDP per capita is also widely described as a tool to gauge the standard of living within a country or province. According to economist Trevor Tombe, the poorest five provinces now rank amongst the six poorest jurisdictions in all North America. This is a staggering reality. Ontario ranks just ahead of Alabama, and British Columbia is poorer than Kentucky. Alberta is Canada’s wealthiest province and would rank 14th amongst U.S. states.
Chart 3: Canadian GDP per capita expressed as a percentage of the U.S.
Source: OECD
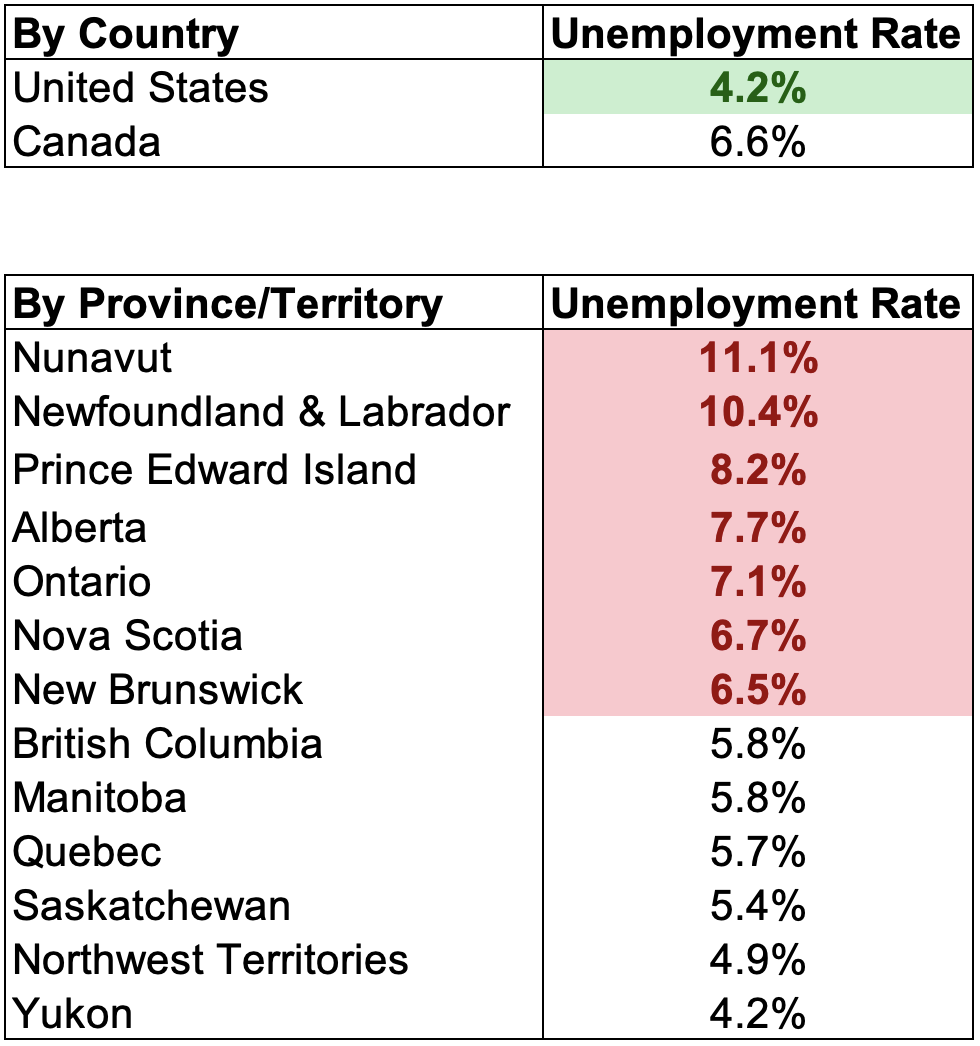
The unemployment rate measures the percentage of the labour force that is actively seeking employment but is currently without a job. It is calculated by dividing the number of unemployed individuals seeking work within a country or province by the total labour force, and then multiplying by 100. Chart 4 compares the unemployment rate between Canada, its provinces/ territories, and the United States. As of August 2024, Canada’s unemployment rate was 6.6% versus America’s 4.2%. The unemployment rate in many of our Canadian provinces is very high and even large economic provinces for Canada such as Alberta and Ontario have unemployment rates of 7.7% and 7.1%. Many U.S. states have almost full employment, so it’s disheartening to see such a poor Canadian economy.
It’s also worth mentioning that these unemployment figures do not take underemployment into account, which refers to a situation where individuals do find work, but it’s in roles that do not encompass their skills or qualifications – A fresh engineering graduate working as a barista, for example.
Chart 4: Comparing unemployment rates between Canada, its provinces/ territories, and the U.S.
Source: Statistics Canada, U.S. Bureau of Labor Statistics
Company Highlight

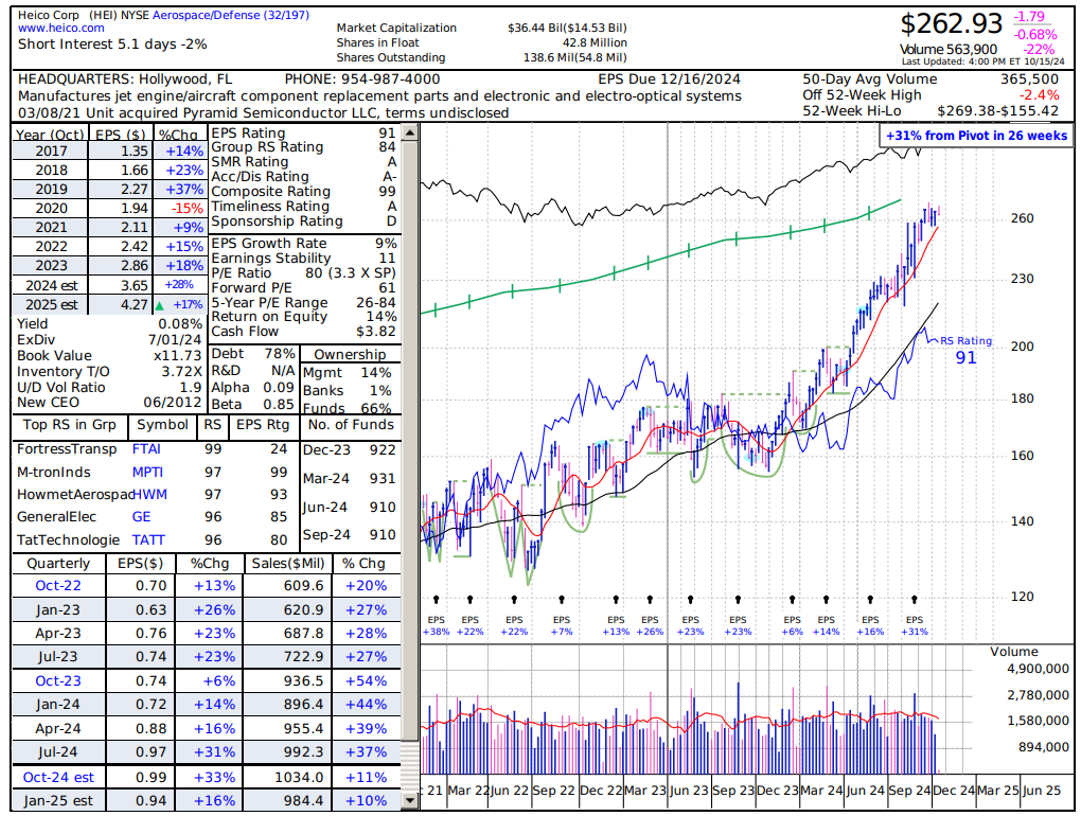
We added Heico Corporation (HEI-US) to our client portfolios a few months ago. This business is a U.S. based technology-driven industrial company that primarily operates under two segments: Flight Support Group (FSG) and Electronic Technologies Group (ETG). The FSG segment focuses on providing parts, repair, and maintenance services for airplanes. It also designs, manufactures, and distributes replacement parts for jet engines, aircraft components, and systems. The ETG segment is dedicated to producing advanced electronic components and systems. Heico’s ETG products are mainly used in their aerospace business, but they also have exposure to medical, telecom, and other industrial markets. They specialize in high-reliability electronics, sensors, and other precision components essential to many critical applications.
After we took our position, it was announced in mid-August that Warren Buffett’s Berkshire Hathaway initiated a ~ $200 million position in Heico. The stock has been a great performer for us, and we like the underlying fundamentals of the business long-term (Chart 5).
Chart 5: Heico Corporation has been a steady long-term industrial compounder
As we conclude this update, we remain committed to helping you navigate the ever-changing financial landscape with confidence and clarity. Our team is continuously monitoring market trends and economic conditions to keep your financial strategies aligned and well positioned for the future.
If you have any questions, please feel free to reach out. We value the opportunity to work with you and appreciate your continued trust in our team.